IMPORTANT CHART PATTERNS EVERY TRADER MUST KNOW
In the table below you will find the most commonly used chart patterns. Following the logic behind traders behaviour we can conclude that these patterns work because many people use them. By the way this logic applies to basically everything in forex. As more people rely on a single trading tool, the more accurate this tool becomes. This is why support and resistance and trend lines work so well.
Trend Continuation Patterns
NAME |
DESCRIPTION | EXAMPLE | DIRECTION |
|---|---|---|---|
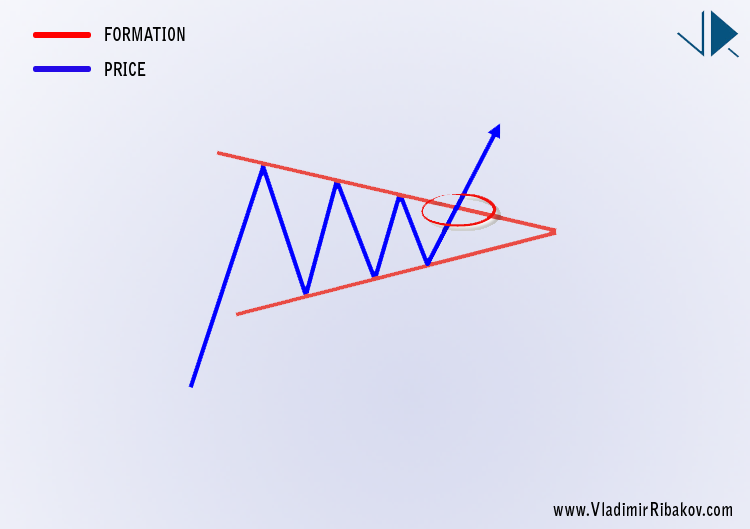
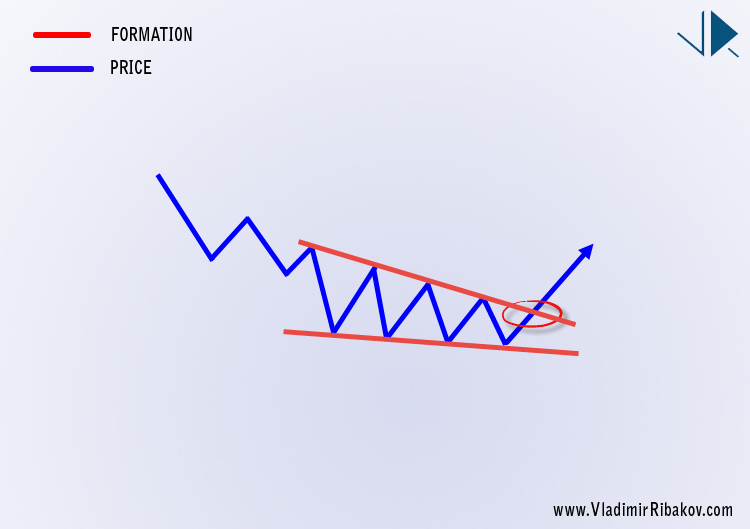
| Symmetric Triangle | Either Up or Down expected after the break, depending in what trend the pattern emerges |
|
|
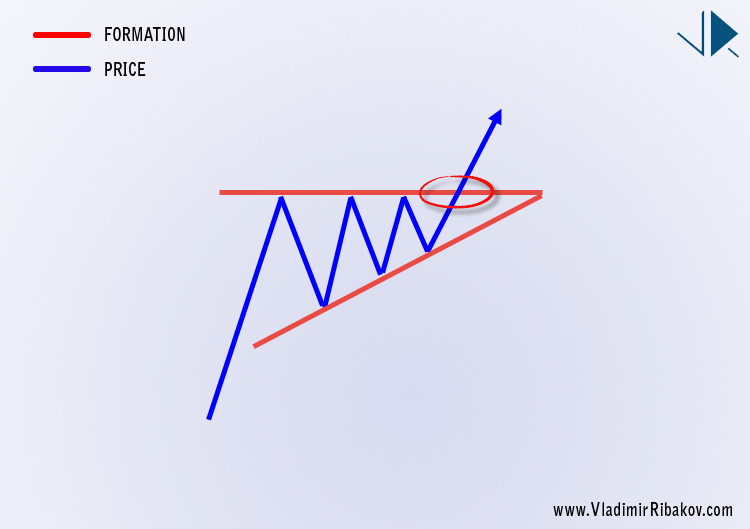
| Ascending Triangle | Bullish continuation expected after the break |
|
|
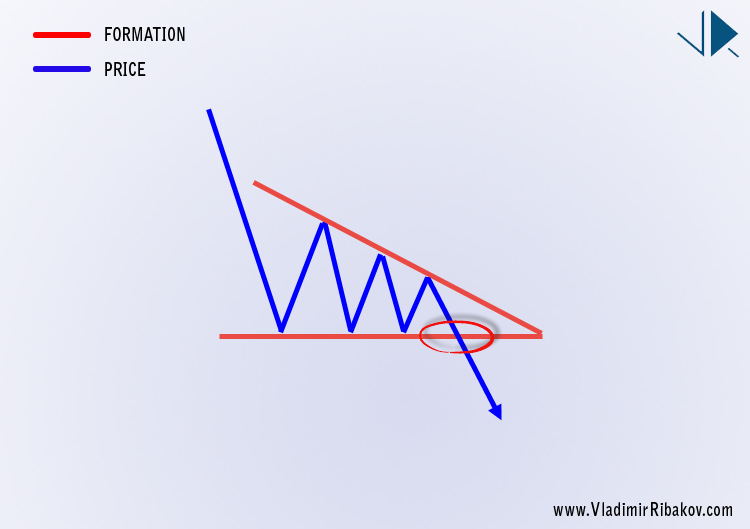
| Descending Triangle | Bearish continuation expected after the break |
|
|
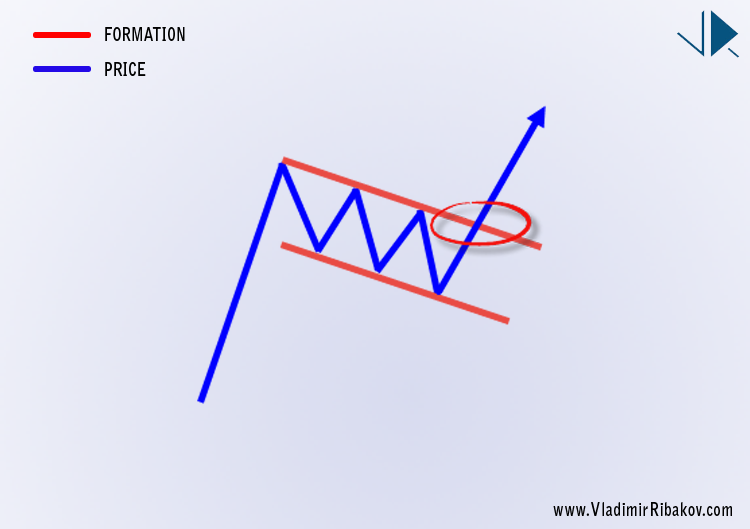
| Bullish Flag | Bullish continuation expected after the break |
|
|
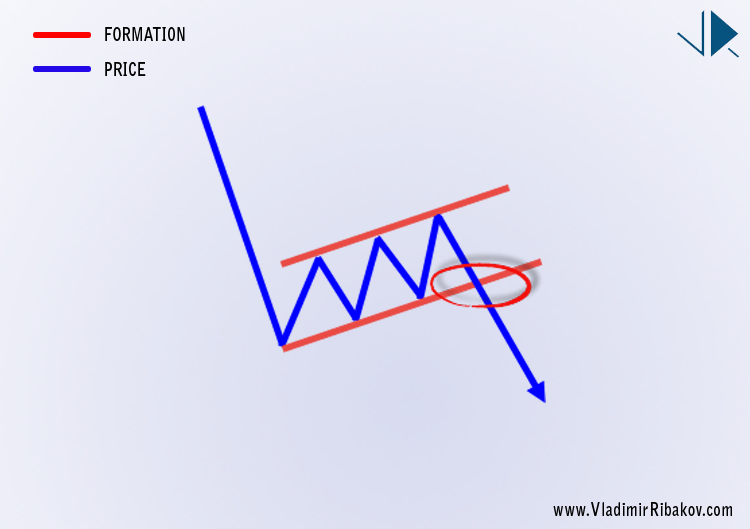
| Bearish Flag | Bearish continuation expected after the break |
|
Trend Reversal Patterns
NAME |
DESCRIPTION |
EXAMPLE |
DIRECTION |
|---|---|---|---|
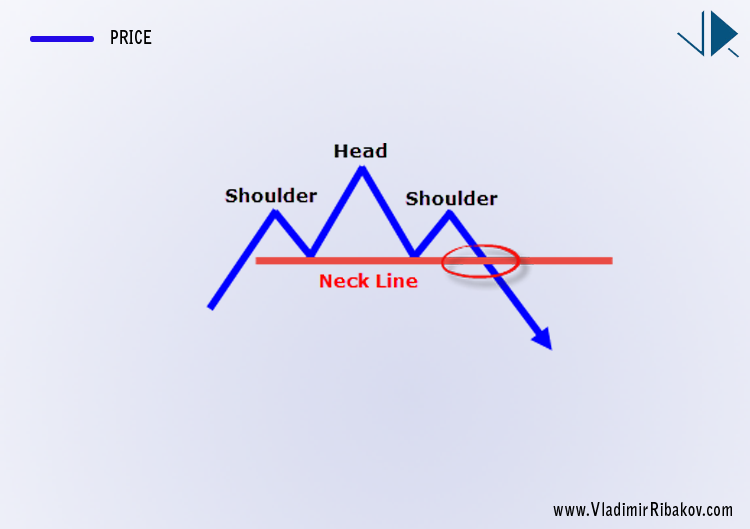
| Head & Shoulders | Bearish reversal expected after the break of the neck line. |
|
|
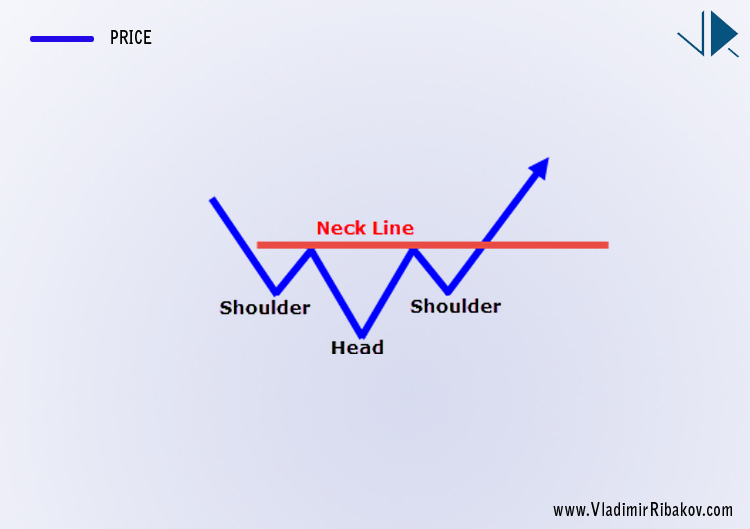
| Inverted Head & Shoulders | Bullish reversal expected after the break of the neck line. |
|
|
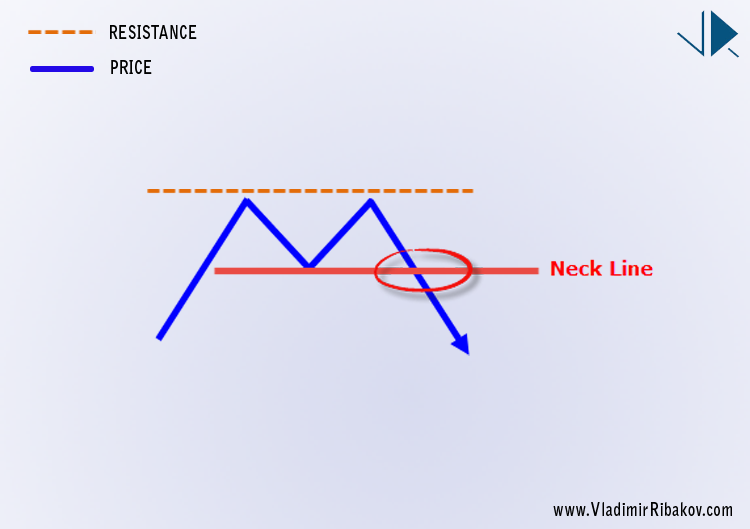
| Double Top | Bearish reversal expected after the break of the neck line. |
|
|
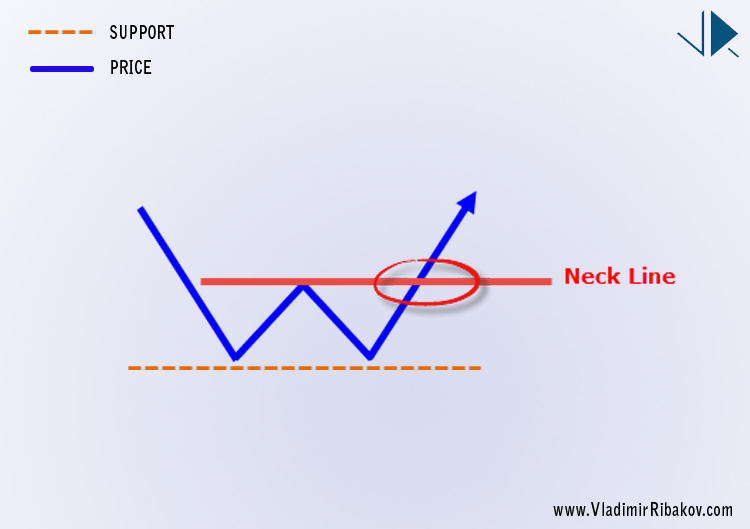
| Double Bottom | Bullish reversal expected after the break of the neck line. |
|
|
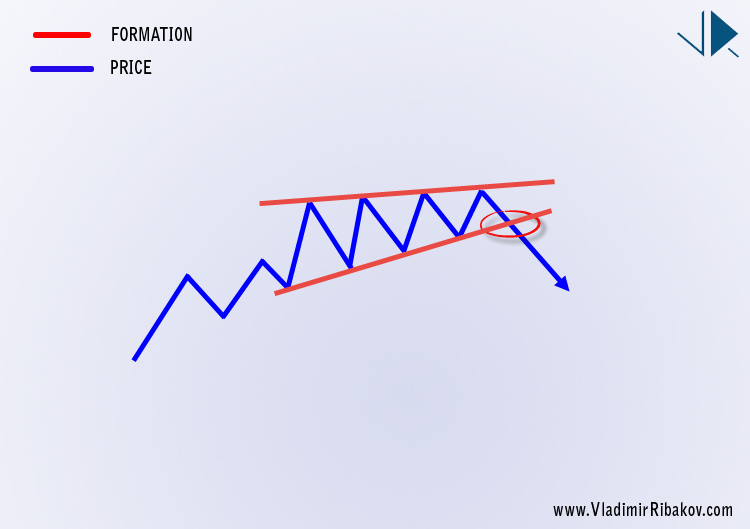
| Rising Wedge | When formed in an uptrend, bearish reversal is expected next. |
|
|
| Falling Wedge | When formed in a downtrend, bullish reversal is expected next. |
|
DIVERGENCES
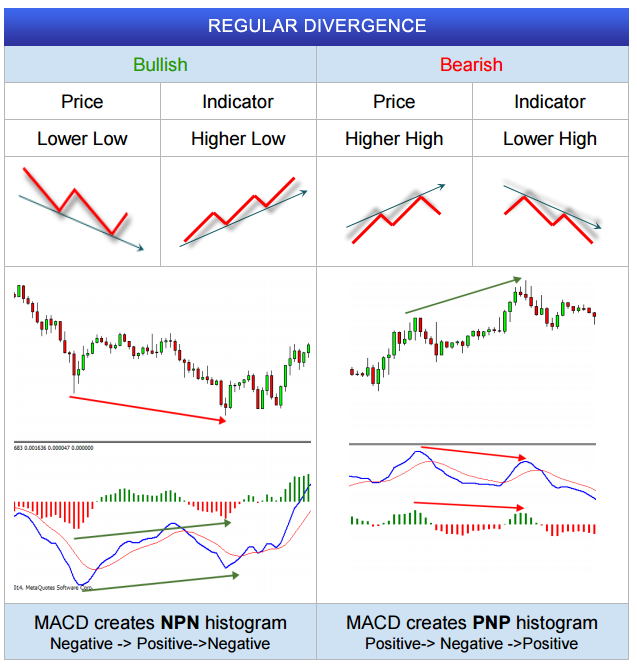
If you’ve been following me for some time you probably know that Divergences are my favorite trading method among other tools i use. And of course there is a reason for that ( I don’t just blindly believe in anything). Divergences occur when there is disbalance between the actual price and an oscillator indicator (RSI, MACD, STOCHASTIC). When this disbalance happens it is only natural for things to balance out and get back to normal. This is where traders look for entries, when this disbalance occurs.
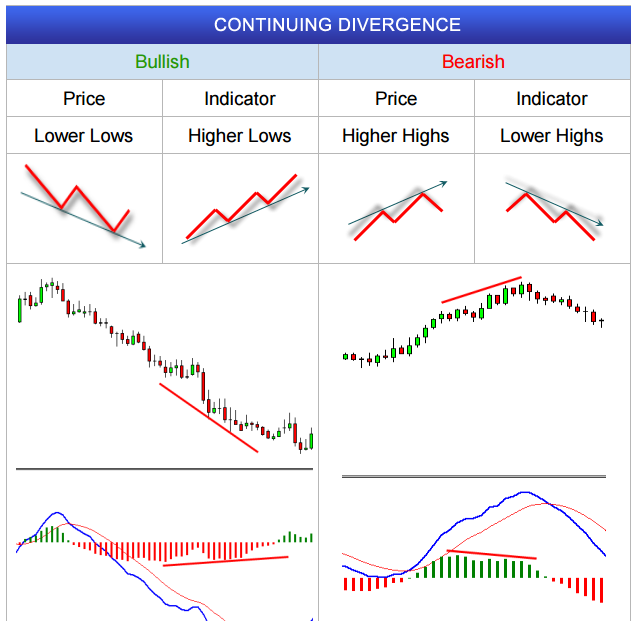
There are three main types of divergences – Regular, Hidden and Continuing. Below i have created kind of a divergence cheat sheet which will help you understand better what divergence is forming.
Divergence Cheat Sheet

Breakouts, Bounces and False Breakouts
Now that you know what Support/Resistance and Trend Lines are, and how they work, it is vital to pay attention to the breakouts and bounces. I know traders who make a living trading only key support/resistance/trend line zones and their breakouts or bounces. So what exactly am I talking about? Let’s get to it..
Breakouts:
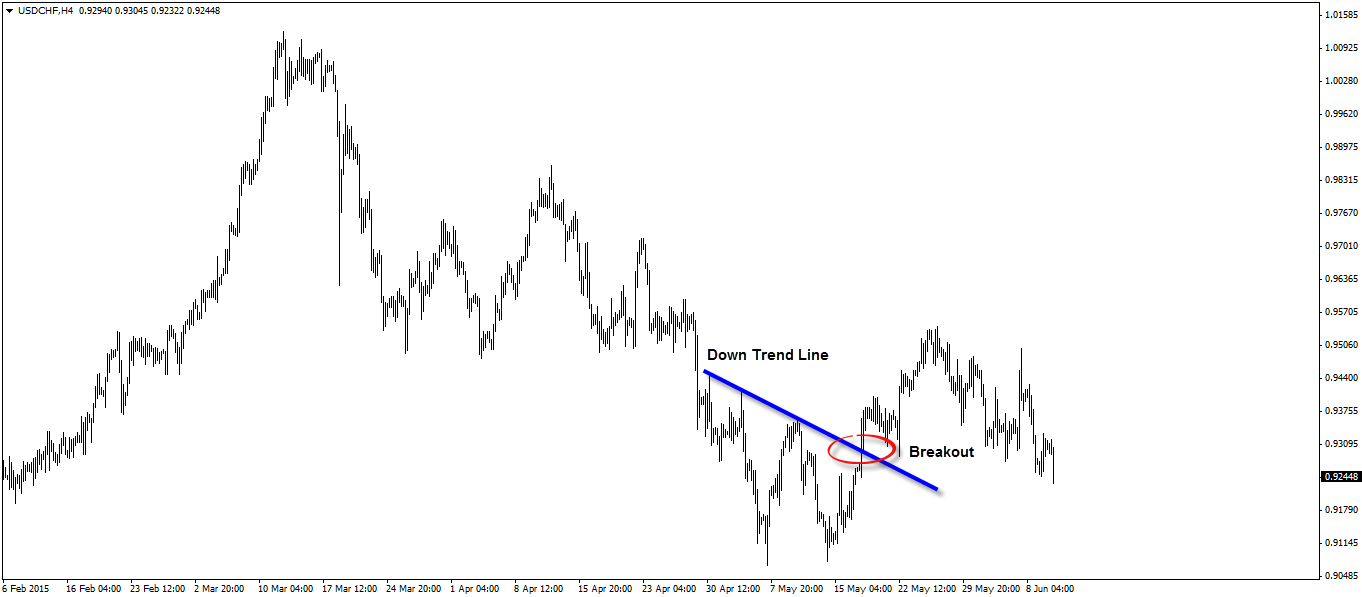
A breakout refers to a price level which was broken. Usually used in the context of supports/resistances and trend lines but not limited to. There could be a breakout of chart pattern (triangle, wedge) or last high/low of previous candle. Here is an example:
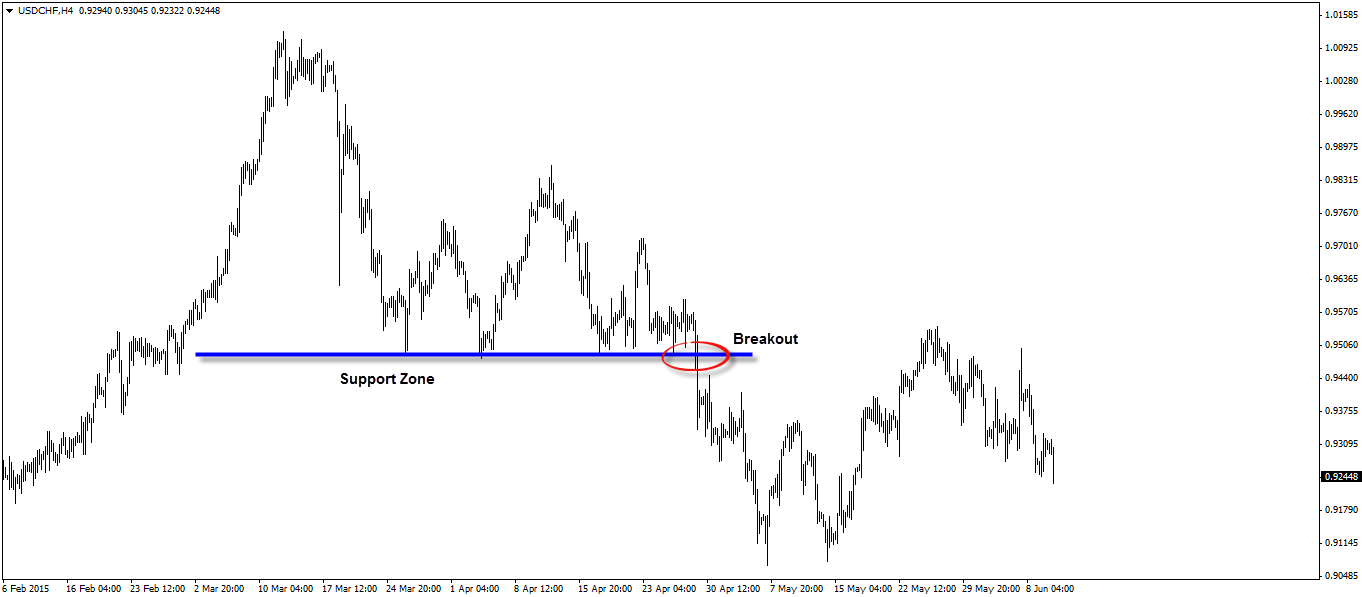
You can see how the price respected the zone near the blue line several times confirming that this is indeed a strong level. Let’s look at another example:
One more example this time we have a chart pattern that was broken up:

I think you get the point. So enough theory, let’s see how all this can help us in trading.
Trading the Breakout
Basically there are two ways you can trade the breakouts – with the momentum (aggressively) or on the re-test of the break (conservatively). Personally I’m and I have always been a conservative trader so I’d rather go with the conservative entries. Keep in mind we want to see a close below/above the given level.
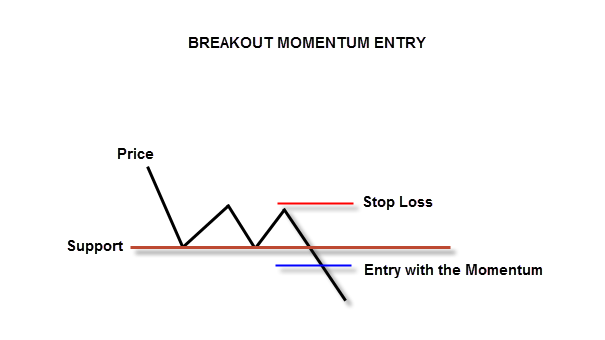
Momentum (Aggressive) Breakout Entry:
As I said above going with the momentum when there is a breakout is a more aggressive approach. However there is one little trick that you can implement. Whenever the bar closes below/above the breakout level, if the closing price is close to the support or resistance go ahead and take the trade. If the bar closes too far away it might not be the best idea to enter with the momentum.
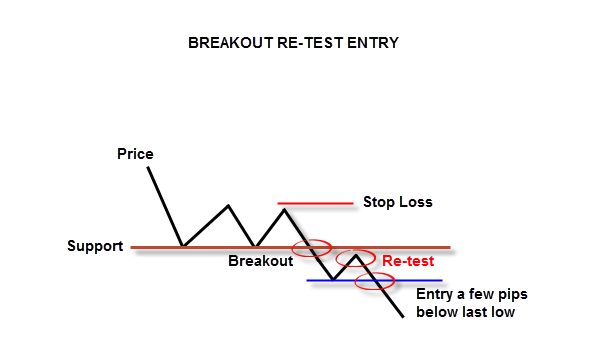
Re-test (Conservative) Breakout Entry:
This is how the conservative breakout entry scenario looks like. Ideally the price won’t penetrate too deep but just enough, then we will see the formal support zone which now plays the role of a resistance, rejecting the price and keeping it below. Next step is to monitor the last low created and once the price breaks through it we can go ahead and enter a sell trade. It is important to mention though, that many times the price will just continue in the initial breakout direction without re-testing. Don’t go nuts about it, if you were waiting for this conservative setup. It is part of the game. You miss some entries when trading conservatively but you also miss some losses when the price false breaks.
Of course this applies to Trend Lines as well, also chart patterns.
Trading the Bounce
Since we are looking for major support/resistance and trend line zones, it is only natural that the price won’t break through these levels but rather bounce off of them. Which creates another possibility for us traders to enter the market. The bounce trading is very popular among “trend line traders” because when there is a trend line and the price is bouncing off of it, that means we are in a trend.
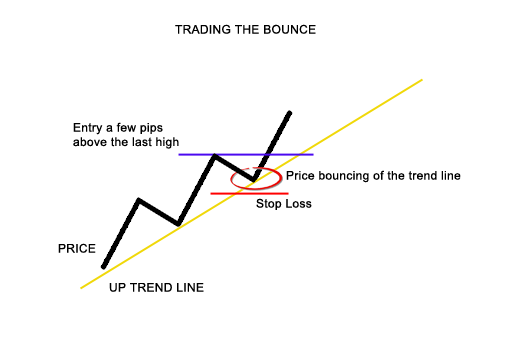
Here is another scenario where we can trade the bounce off a horizontal support/resistance:
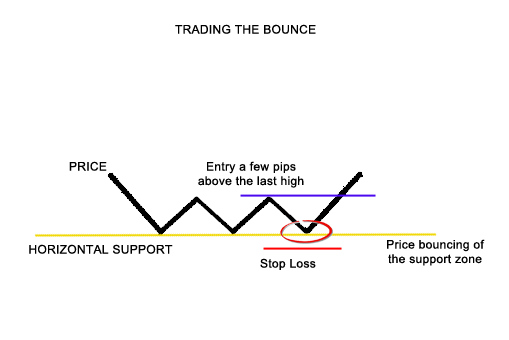
It is important to stick to your initial trading plan and stop loss. If the price breaks through get out of the trade. Don’t just pray to the forex gods for a reversal. Which brings us to the next subject False Breakouts.
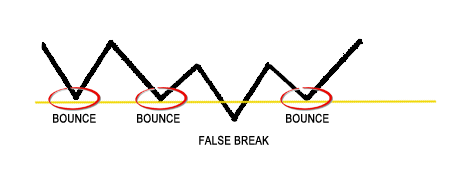
Trading False Breakouts
You know now what to do when the price is bouncing or breaking through. It would’ve been a perfect world where all forex traders are billionaires if everything went this way. Unfortunately this is not the case and sometimes we experience false breaks. As the name suggest this is the situation where the price breaks through the support/resistance/trend line level and it looks like it is going in the direction of the break but it reverses after a while and continues to move in the other direction. Don’t panic i’ve got you covered even in this not so very pleasant situation. As a matter of fact False Breaks are not as bad as they might seem at a first glance. When you attach certain rules to them they can be very profitable as well.
This could be very annoying and frustrating for the rookie trader. Now let’s say that in case the price closes above this support that it just broke we can consider this situation a false break and we can take advantage of it. There are two ways you can trade the false breaks – conservatively and aggressively.
Conservative False Break Entry:
The conservative false break setup would trigger our entry only after the following process have been completed. For the sake of the example I will focus on the case where the price is dropping and it is reaching a dynamic resistance zone (trend line).
1. Price respecting numerous time the trend line
2. Price breaks through the trend line and closes above it.
3. Within 1 bar price breaks down again and closes below the trend line.
4. Open Sell order at the close of this bar
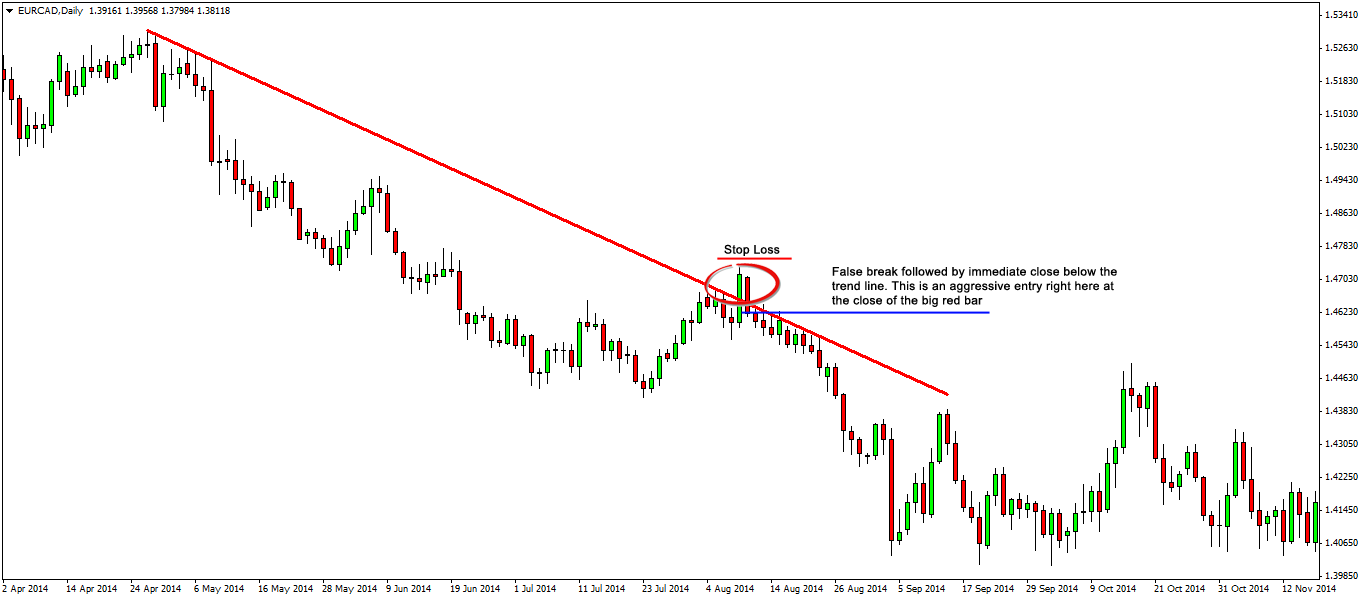
Keep in mind that the false break might happen within a few bars.
Conservative False Break Entry:
For the conservative entry we follow the same scenario but the entry would happen only when the price breaks below the last swing low.