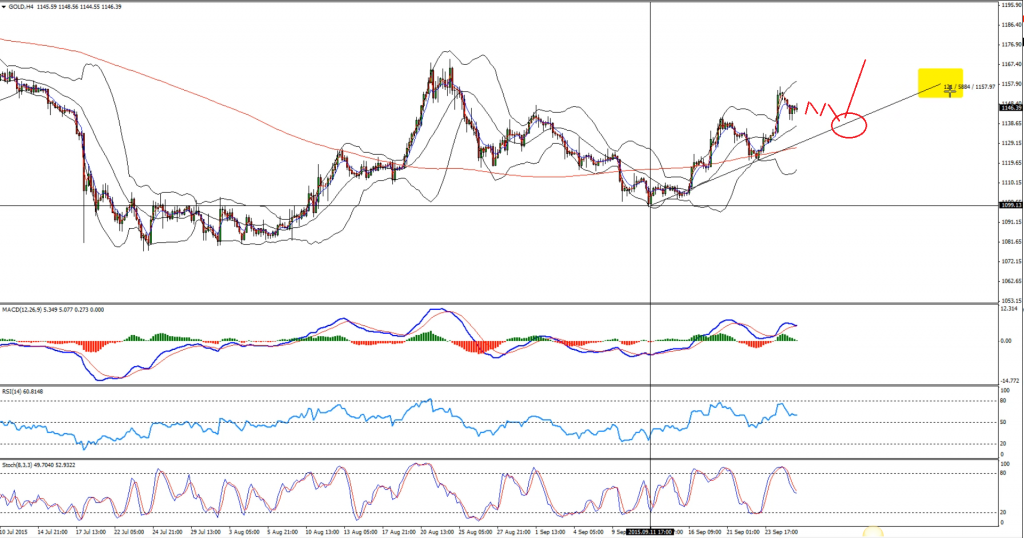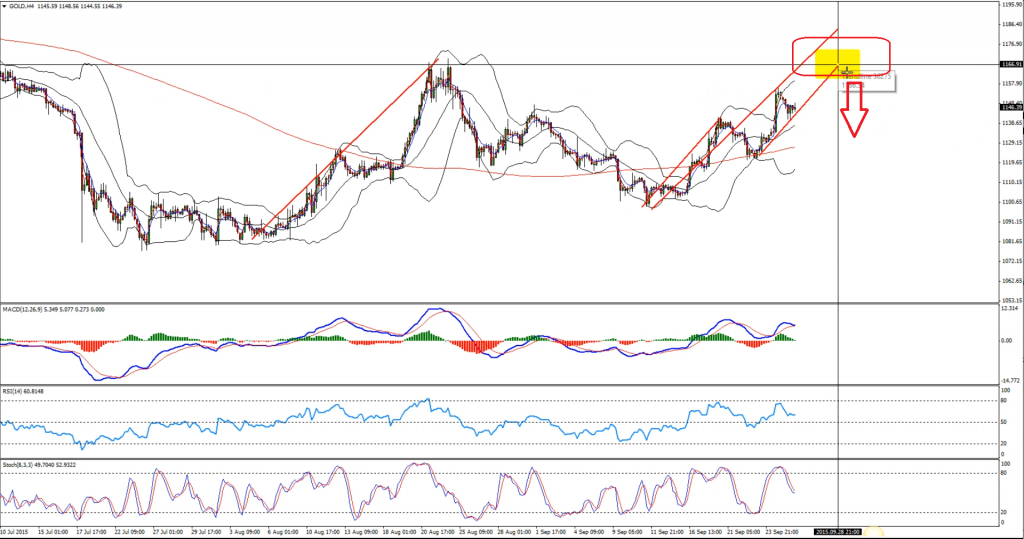
GOLD is enjoying a decent bullish run, and it might continue to trade higher in the short term. Our idea for now is to remain bullish as long as a bullish trend line on the 4-hours chart holds. However, once the price reaches a very important resistance area of $1165-70 there is a chance of it facing sellers.
There is a wave duplication pattern developing on the 4-hours chart, which might complete around $1166-70 level. In that scenario, we might consider entering a sell trade.
Technical Analysis
Buy Entry
H4– We can enter a buy trade in GOLD if it corrects lower in two waves and trades near the trend line and support area (as shown in the chart).
Target 1: $1160
Target 2: $1165
Stop Loss: Break and close below the trend line.
Sell Entry:
H4– We can enter a sell trade in GOLD once it completes the wave duplication pattern and trades near $1166-70.
Target 1: $1150
Target 2: $1135
Stop Loss: Break and close above the last high created before entering into the trade.
Video Explanation:
Yours,
Vladimir


