


Hi Traders!
In this guide we will cover the Parabolic SAR indicator and how to trade with it. Let’s begin!
[Video Dedicated to Parabolic SAR Indicator + Free Strategy]
Parabolic SAR
In technical analysis, parabolic SAR (parabolic stop and reverse) is a method devised by J. Welles Wilder, Jr., to find potential reversals in the market price direction of traded instruments. It is a trend-following (lagging) indicator and may be used to set a trailing stop loss or determine entry or exit points based on prices tending to stay within a parabolic curve during a strong trend.
Similar to option theory’s concept of time decay, the concept draws on the idea that “time is the enemy”. Thus, unless a security can continue to generate more profits over time, it should be liquidated.
The indicator generally works only in trending markets, and creates “whipsaws” during ranging or, sideways phases. Therefore, Wilder recommends first establishing the direction or change in direction of the trend through the use of parabolic SAR, and then using a different indicator such as the Average Directional Index to determine the strength of the trend.
One of the most interesting aspects of this indicator is that it assumes that a trader is fully invested in a position at any point in time. For this reason, it is of specific interest to those who develop trading systems and traders who wish to always have money at work in the market.
The calculation of this indicator is rather complex and goes beyond the scope of how it is practically used in trading. For those of you interested in the formula, you will find it below.
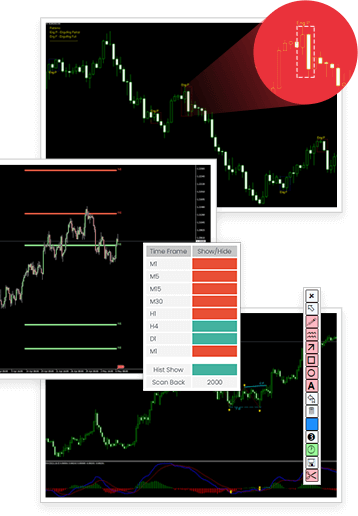
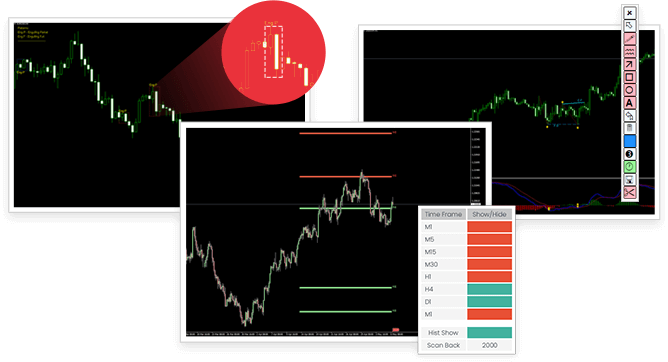
The parabolic SAR indicator is graphically shown on the chart of an asset as a series of dots placed either above or below the price (depending on the asset’s momentum).
A small dot is placed below the price when the trend of the asset is upward, while a dot is placed above the price when the trend is downward.
As you can see from the chart below, transaction signals are generated when the position of the dots reverses direction and is placed on the opposite side of the price as it was earlier.


Parabolic SAR Formula and Calculation
The parabolic SAR is calculated almost independently for each trend in the price. When the price is in an uptrend, the SAR emerges below the price and converges upwards towards it. Similarly, on a downtrend, the SAR emerges above the price and converges downwards. At each step within a trend, the SAR is calculated one period in advance. That is, tomorrow’s SAR value is built using data available today. The general formula used for this is:
{\displaystyle {SAR}_{n+1}={SAR}_{n}+\alpha (EP-{SAR}_{n})}
where SARn and SARn+1 represent the current period and the next period’s SAR values, respectively.
EP (the extreme point) is a record kept during each trend that represents the highest value reached by the price during the current uptrend – or lowest value during a downtrend. During each period, if a new maximum (or minimum) is observed, the EP is updated with that value.
The α value represents the acceleration factor. Usually, this is set initially to a value of 0.02, but can be chosen by the trader. This factor is increased by 0.02 each time a new EP is recorded, which means that every time a new EP is observed, it will make the acceleration factor go up.
The rate will then quicken to a point where the SAR converges towards the price. To prevent it from getting too large, a maximum value for the acceleration factor is normally set to 0.20.
The traders can set these numbers depending on their trading style and the instruments being traded.
Generally, it is preferable in stocks trading to set the acceleration factor to 0.01, so that is not too sensitive to local decreases. For commodity or currency trading, the preferred value is 0.02.
The SAR is calculated in this manner for each new period. However, two special cases will modify the SAR value:
- If the next period’s SAR value is inside (or beyond) the current period or the previous period’s price range, the SAR must be set to the closest price bound. For example, if in an upward trend, the new SAR value is calculated and if it results to be more than today’s or yesterday’s lowest price, it must be set equal to that lower boundary.
- If the next period’s SAR value is inside (or beyond) the next period’s price range, a new trend direction is then signaled. The SAR must then switch sides.
Upon a trend switch, the first SAR value for this new trend is set to the last EP recorded on the prior trend, EP is then reset accordingly to this period’s maximum, and the acceleration factor is reset to its initial value of 0.02.
References and Sources:
- J. Welles Wilder, Jr. (June 1978). New Concepts in Technical Trading Systems. Greensboro, NC: Trend Research.
- Jump up^ “Parabolic SAR (PSAR)”. Day Trading Encyclopedia. Investors Underground. Retrieved 11 November 2016.
- Wikipedia


Hi Vilad,
Pl tell us how to use this PSAR in day to day trading? Can we use it alone as an indicator or to combine with another indicator? Etc,
Thanks for sharing
Jaisinghp
Hi Jaisingh
There isn’t one right way to do it, there are many variations.
But my favorite – then higher time frames all lined up to the same direction and lower time frame that you prefer to trade, is also there, it’s a good time to start looking to trade that direction.
This is of great use, I appreciate it Vlad
Thank you!