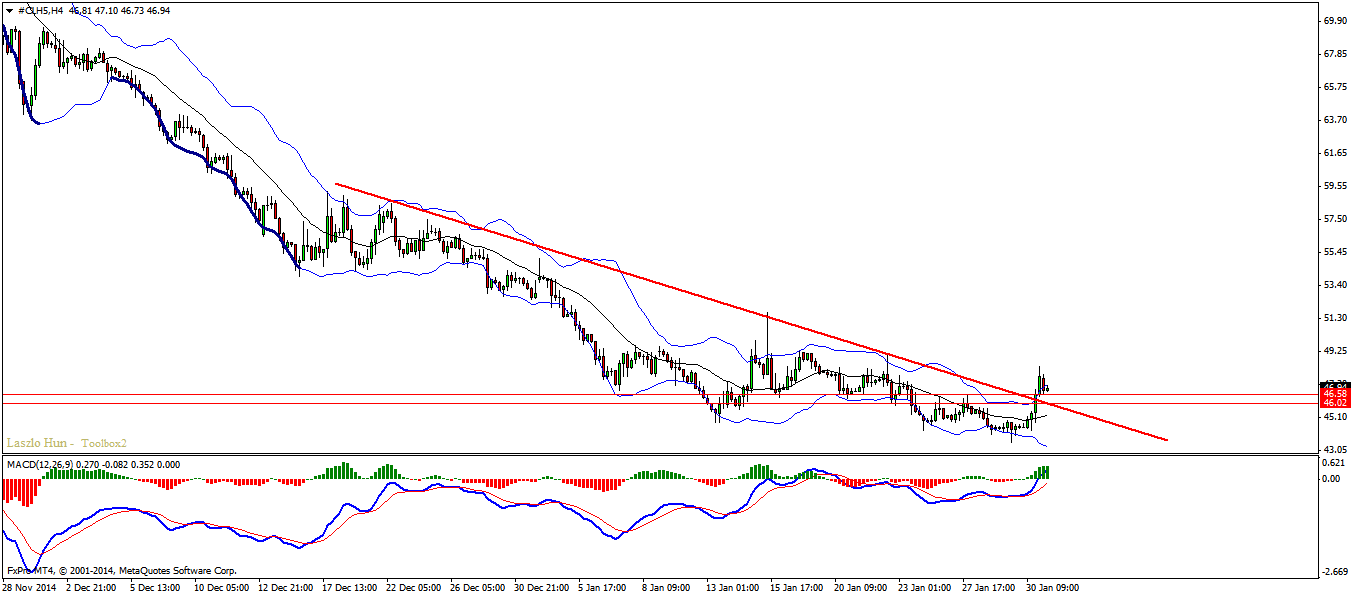
Oil has been on a down run for quite some time and now for the first time we can see some bullish signs. On the H4 chart the down trend line has been breached along with the most recent resistance level, and furthermore Convergence formed on the MACD histogram which is another bullish hint. The plan for the commodity is pretty straightforward – buy dips with double move correction.
Technical Overview:
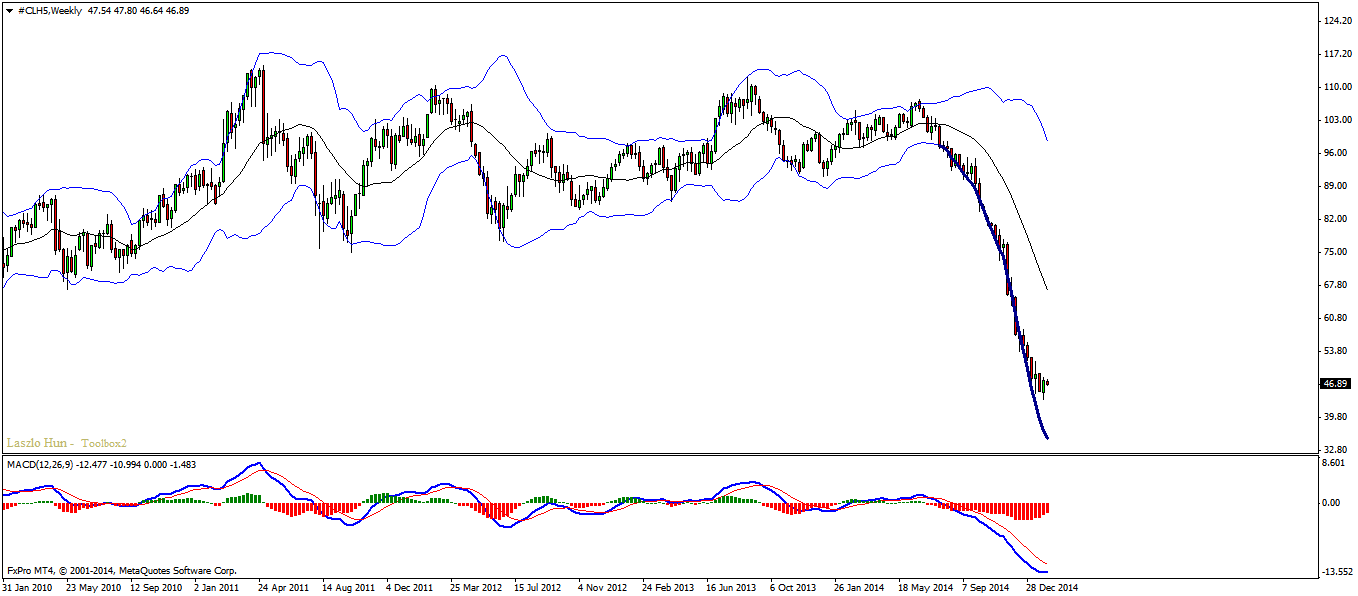
W1 – 20+ candles ride on the Bollinger Bands
H4 – Down trend line broken, resistance zone around 46.50 also broken, bullish convergence on MACD historgram
Entry:
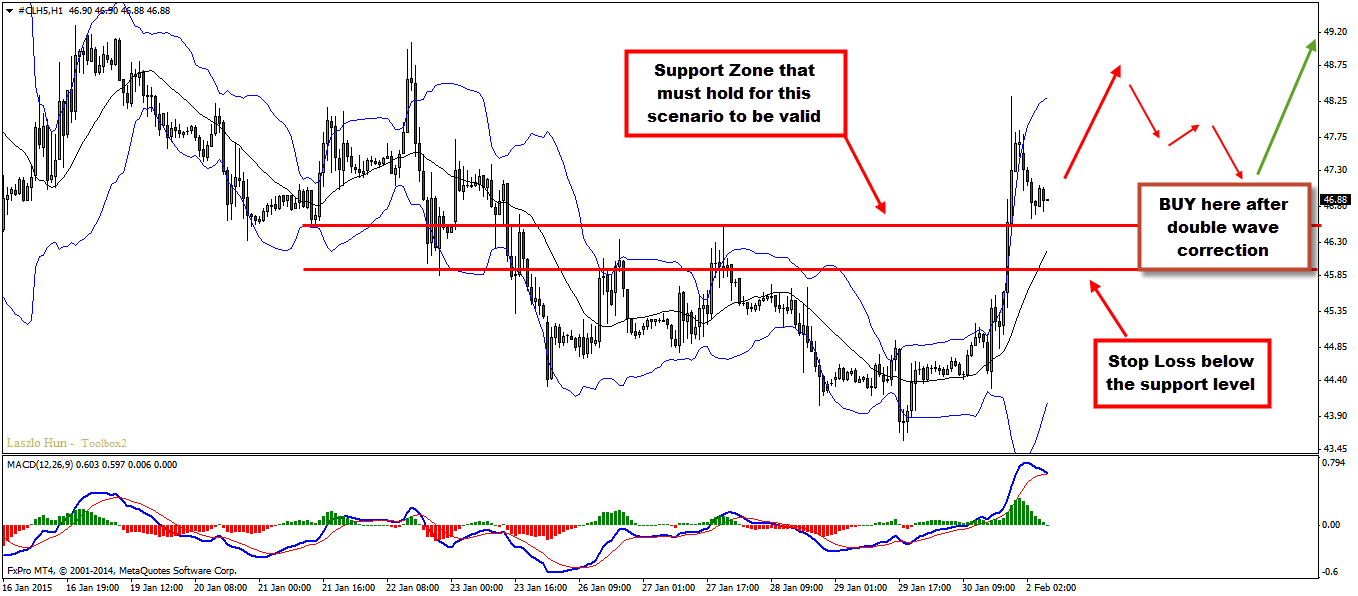
H1 – Wait for double wave correction as shown in the screenshot and look to go long. Keep in mind the pair might first reach 49.00 before going for the deeper retrace that we need. So please be patient and wait for clear and obvious moves before entering a trade.
Target 1: 52.00
Target 2: 53.00
Stop Loss: below 46.50
Video Explanation
Hi Traders! USDJPY short term forecast update and follow up is here. On January 29th,…
Hi Traders! AUDCHF short term forecast and technical analysis is here. We do our analysis…
World markets rapidly reversed course on Monday after U.S. President Donald Trump said he will…
Hi Traders! Arvinth here from the Home Trader Club team. The weekly summary and, review of March…
Gold sank for a seventh session as the escalating war in the Middle East drove oil…
Hi Traders! EURGBP short term forecast and technical analysis is here. We do our analysis…