Hi Traders! CADCHF short term forecast update and follow up is here. On April 23rd I shared this “CADCHF Short Term Forecast And Technical Analysis” in this post lets do a recap of this setup and see how it has developed now. If you would like to learn more about the way we trade and the technical analysis we use then check out the Traders Academy Club. Spoiler alert – free memberships are available!
Missed this trade?
Never miss a trade opportunity again! Join the Traders Academy Club
Now lets summarize the idea first:
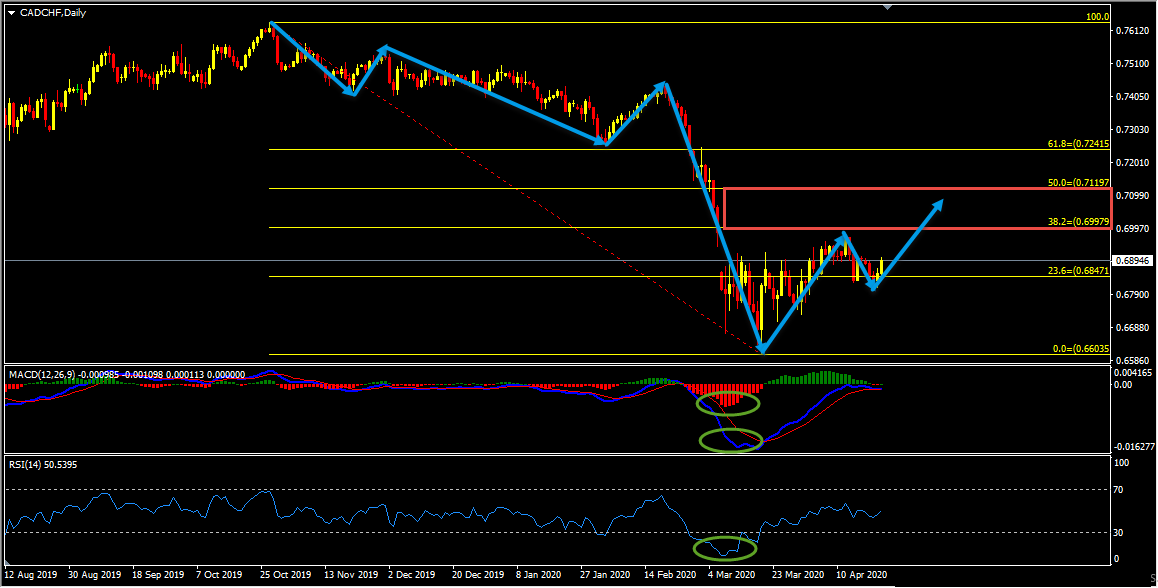
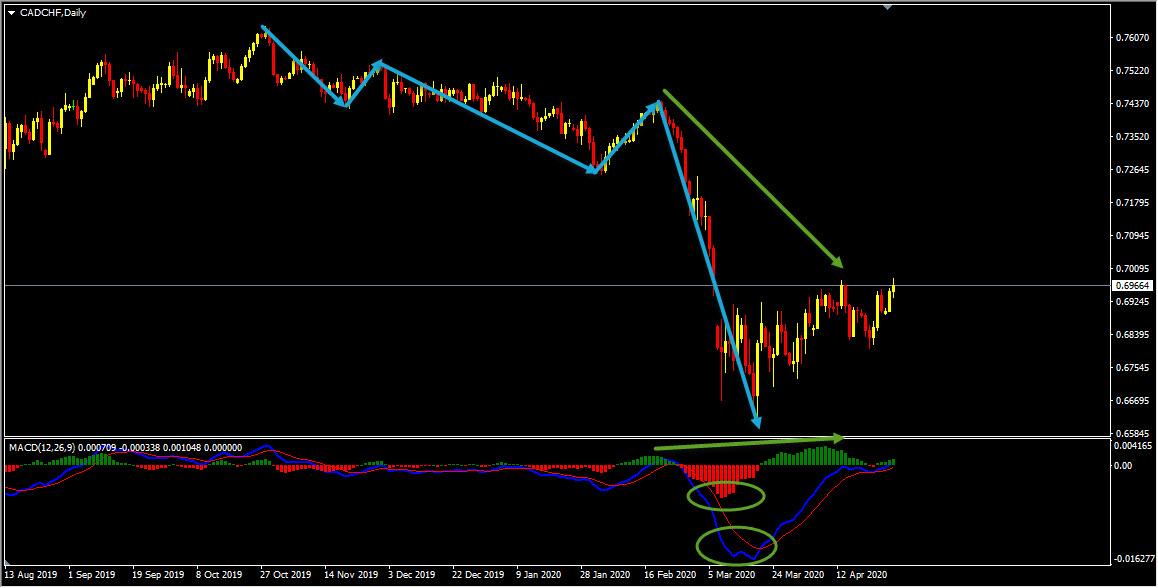
Bearish Trend Pattern, Extreme Divergence, Important Resistance Zone
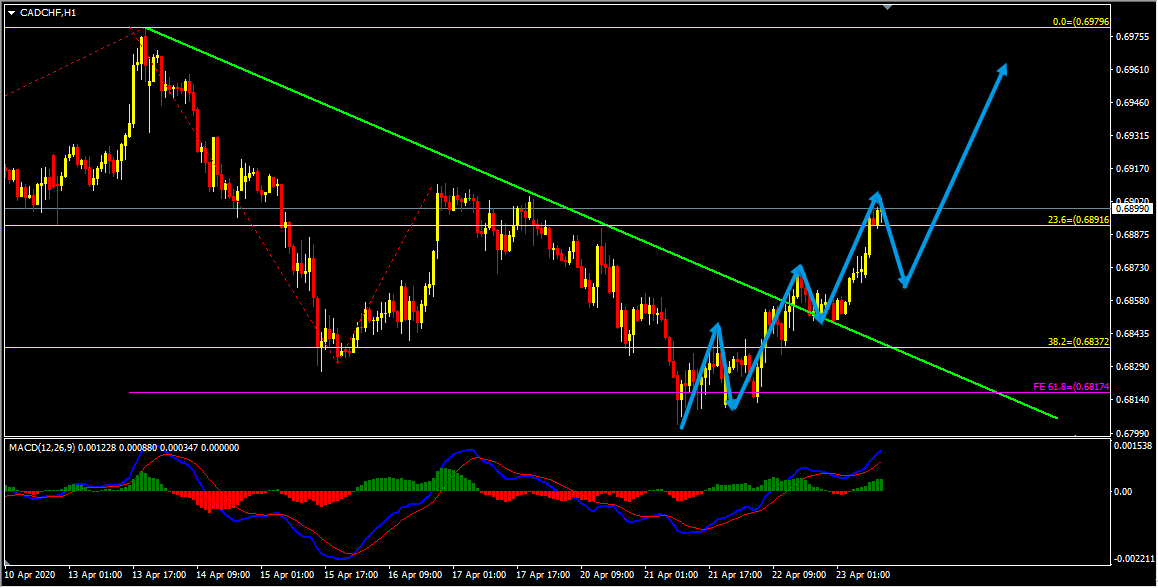
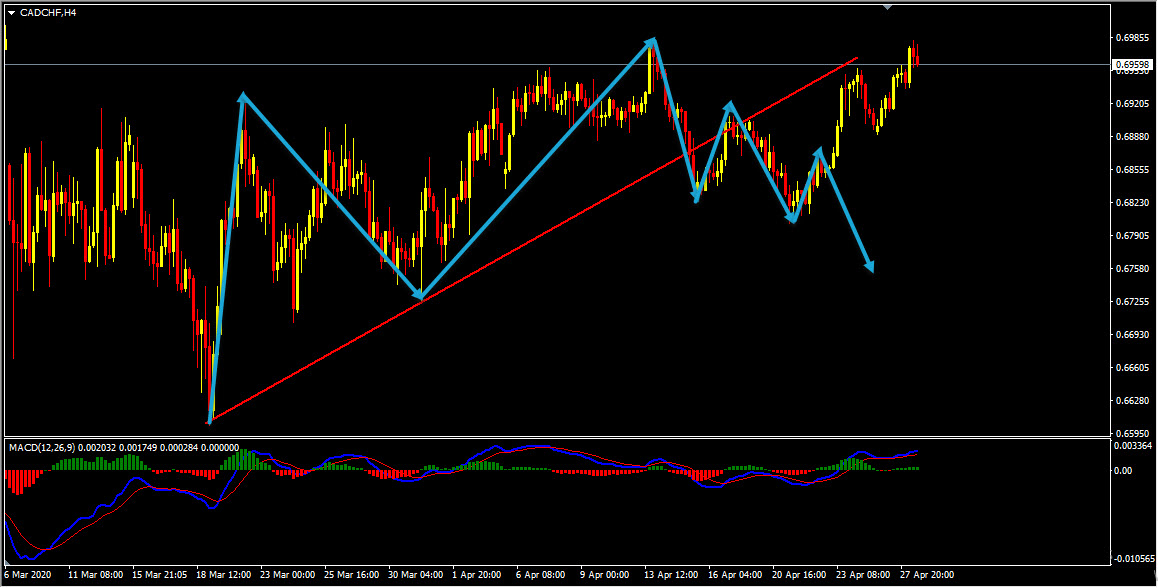
Bullish Trend Pattern, Bullish Divergence, Uptrend Line Breakout, ADX Indicator
Looking at the H1 chart we could see that it is in perfect synchronization with the higher timeframes as the price has created a bullish trend pattern in the form of three higher highs, higher lows, we may consider this as an evidence of bullish pressure. We may now look for pullbacks and then further continuation higher.
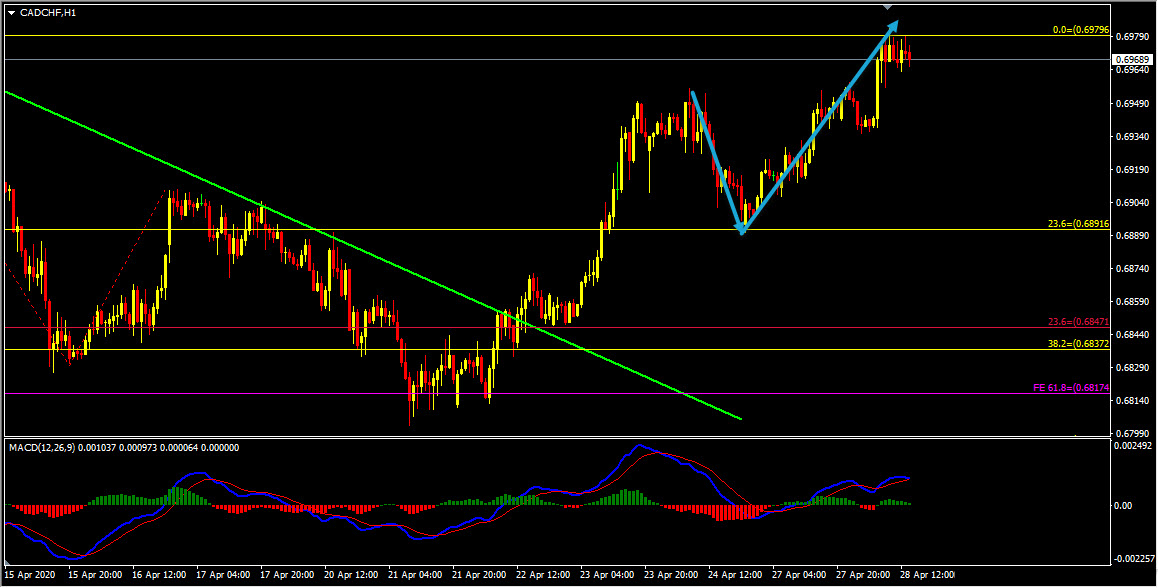
On the H1 chart the price followed my analysis perfectly. The pullback that I was looking for happened and then the price moved higher exactly as I expected, delivering 90+ pips move so far.
This trade is a perfect example of why we should follow the facts. As long as the market follows my ideas and validates my setups I can trade and if it doesn’t switch, have a different read and turn around when required. In this pair my view was bearish because on the daily chart we had a bearish trend pattern and an extreme divergence. It looked like a correction was happening as the price was moving higher, we then had a bearish hidden divergence.
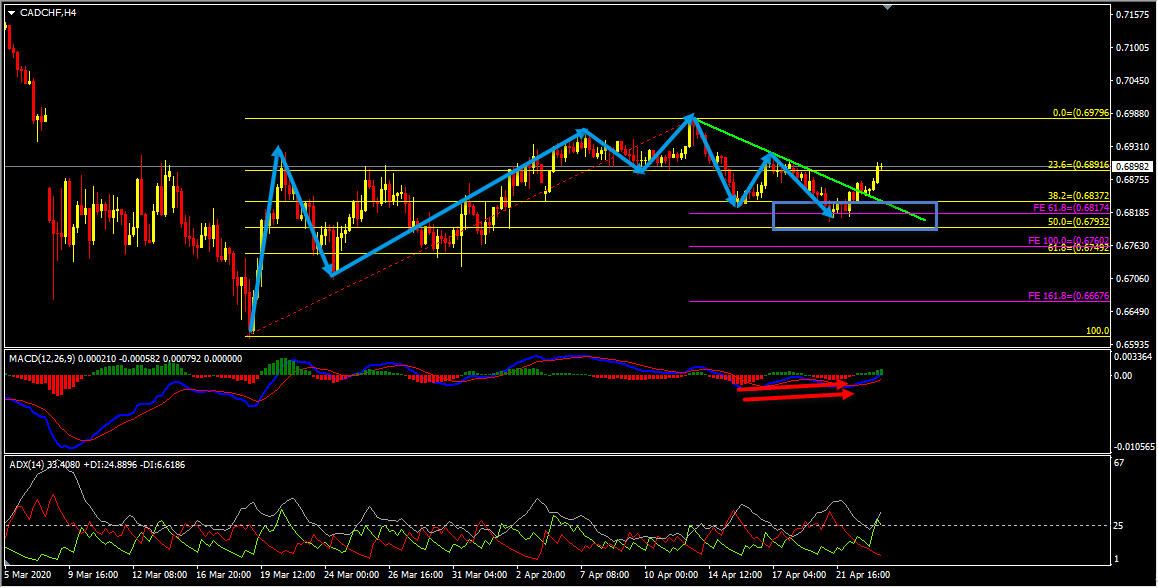
While looking at the H4 chart we could see that the correction has happened in the form of double wave to the upside and the price has also broken below the uptrend line. So I was looking for the price to create a bearish trend pattern in the form of three lower highs, lower lows and then I was expecting a possible continuation lower.
But alternatively, the price instead of creating the third low moved higher and broke above the most recent downtrend line. Here the price didn’t follow the facts as I expected. So I switched and had a different read, I started re-analyzing again from the higher timeframe and we had facts supporting the short term bullish view (you can find my detailed analysis here). This is why I switched to the short term bullish view and the price followed my analysis and moved higher as expected.
So, traders, this is why I wanted to show this example to help you understand how important it is to follow the facts. When the facts doesn’t happen as we expected always in such cases, step back and analyze the charts again maybe we might have missed something. Because these are the kind of hints the market provides us at majority of the times and it’s our obligation as traders to be able to listen to these things that the market tells us and we should try to make the right actions”.
For similar trade ideas and much more join the Traders Academy Club and get access to our complete watch list and trade report.
This is how the report looks like. A table with the hottest market opportunities, screenshot behind every pair and time frame (anything that is in blue inside the table is clickable and leads to a screenshot) + a summary in text format, kind of highlights. And of course Live Trading Room every single day.
If you have any further questions, don’t hesitate to drop a comment below!
To your success,
Vladimir Ribakov
Certified Financial Technician
Hi Traders! Ethereum short term forecast follow-up and update is here. On May 26th, 2026…
Hi Traders! GBPAUD short term forecast and technical analysis is here. We do our analysis…
Hi Traders! USDCHF short term forecast update and follow up is here. On May 20th,…
Hi Traders! CADCHF short term forecast and technical analysis is here. We do our analysis…
The dollar was broadly steady on Monday as cautious investors watched out for signals on…
Hi Traders! Arvinth here from the Home Trader Club team. The weekly summary and, review of July…