The new trading week opens with high expectations and rising tension across the Forex market, as traders prepare for the upcoming Federal Reserve interest rate decision.
While many market participants believe the Fed will not rush into a rate cut, price action suggests something very different. Markets are already behaving as if a cut — or at least a clear signal of aggressive easing — is inevitable.
This disconnect between policy expectations and market pricing is creating powerful technical structures across major currency pairs.
In this weekly forecast, we will focus on EUR/USD, GBP/USD, and EUR/JPY, breaking down the technical outlook, key levels, and high-probability scenarios for the week ahead.
Before we dive in, a big thank you to our partners at Eight Cap Broker for supporting our community.
You can continue enjoying all the exclusive offers we have together with them — including up to one full year of free access to Home Trader Club, all our trading systems and tools, private mentoring sessions, and much more.
? Check out the exclusive offers via the link below the video or on vladimirribakov.com
Don’t forget to Like, Comment, and Subscribe for more weekly plans and real-time insights.
As an Internationally Certified Financial Technician (CFTe, IFTA) and former private capital hedge fund trader, I have successfully mentored numerous students who are now thriving in the trading world. Students who learned with me, are now full-time traders, work in the trading industry, run their own capital firms or are fully funded traders by private companies, develop automated trading solutions and manage others’ capitals. I am a very proud mentor and I am proud of the success stories I’ve helped create, and for a limited time, I’m offering my mentorship program for free through a partnership with Eight Cap broker. Join Eight Cap, become an active trader, and choose the offer that suits you best –
For more details, visit: Home Trader Club Mentorship Program
I’m excited to work with you and help you reach your desired level of success!
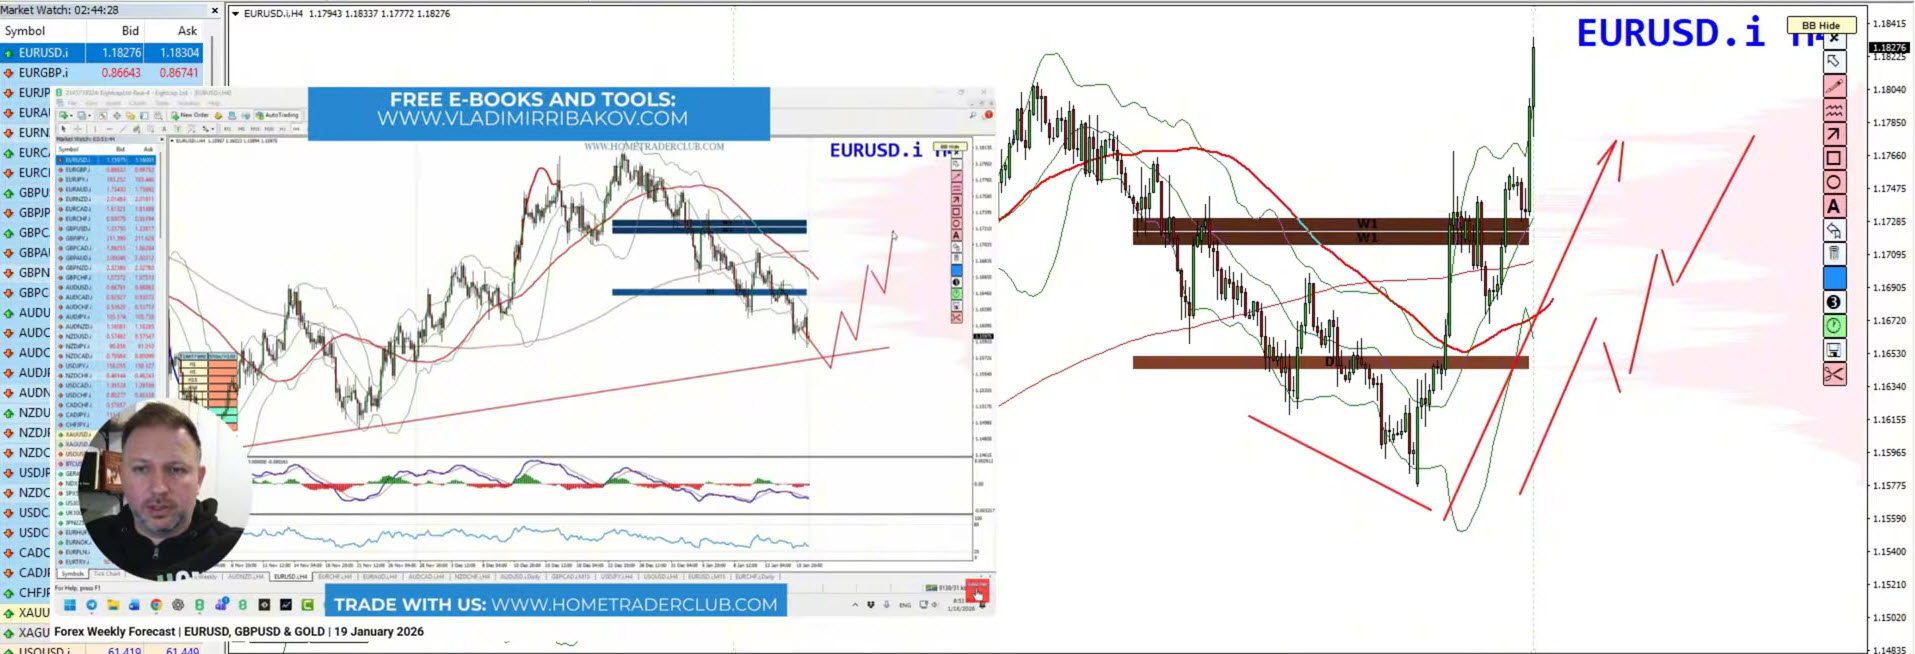
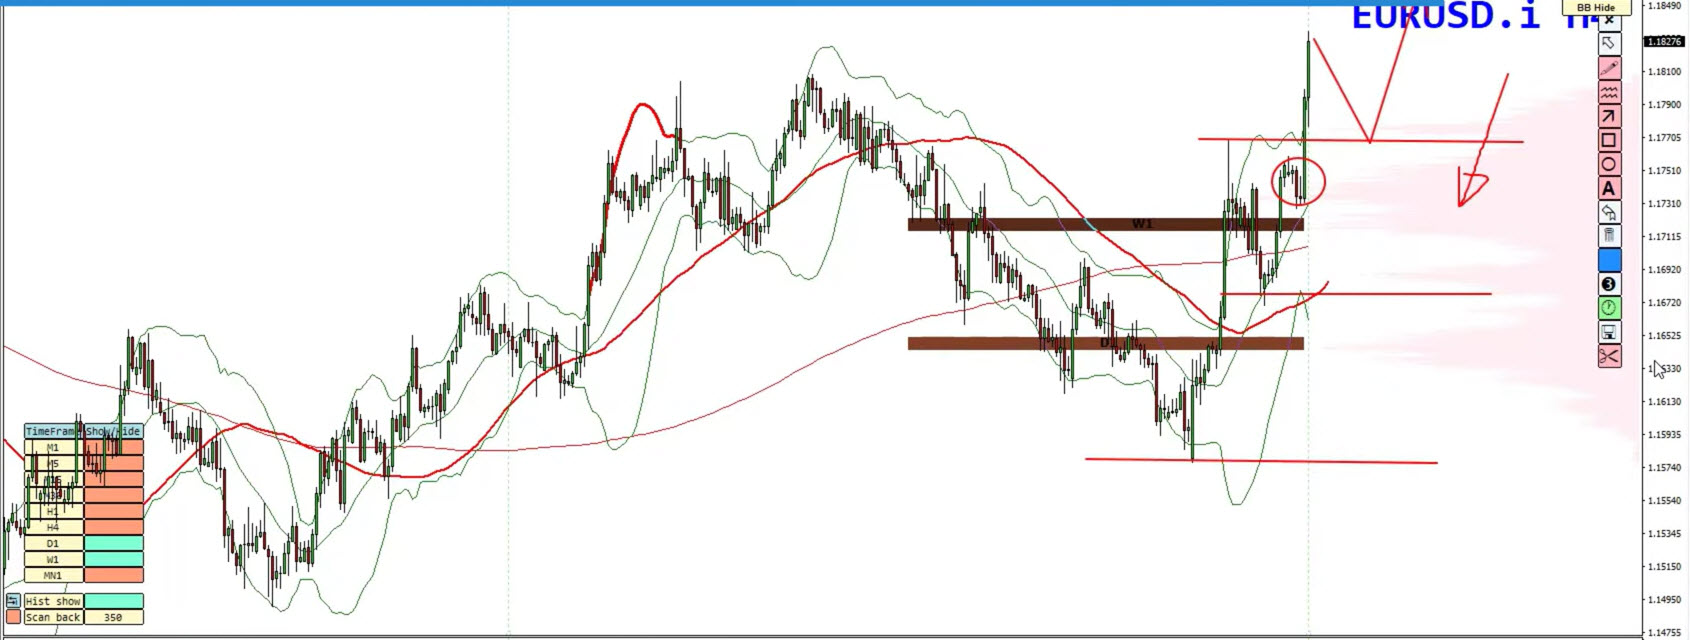
Last week, we discussed the bullish divergence on EUR/USD and the potential for upside continuation. That scenario has played out well, with the pair gaining strong bullish momentum.
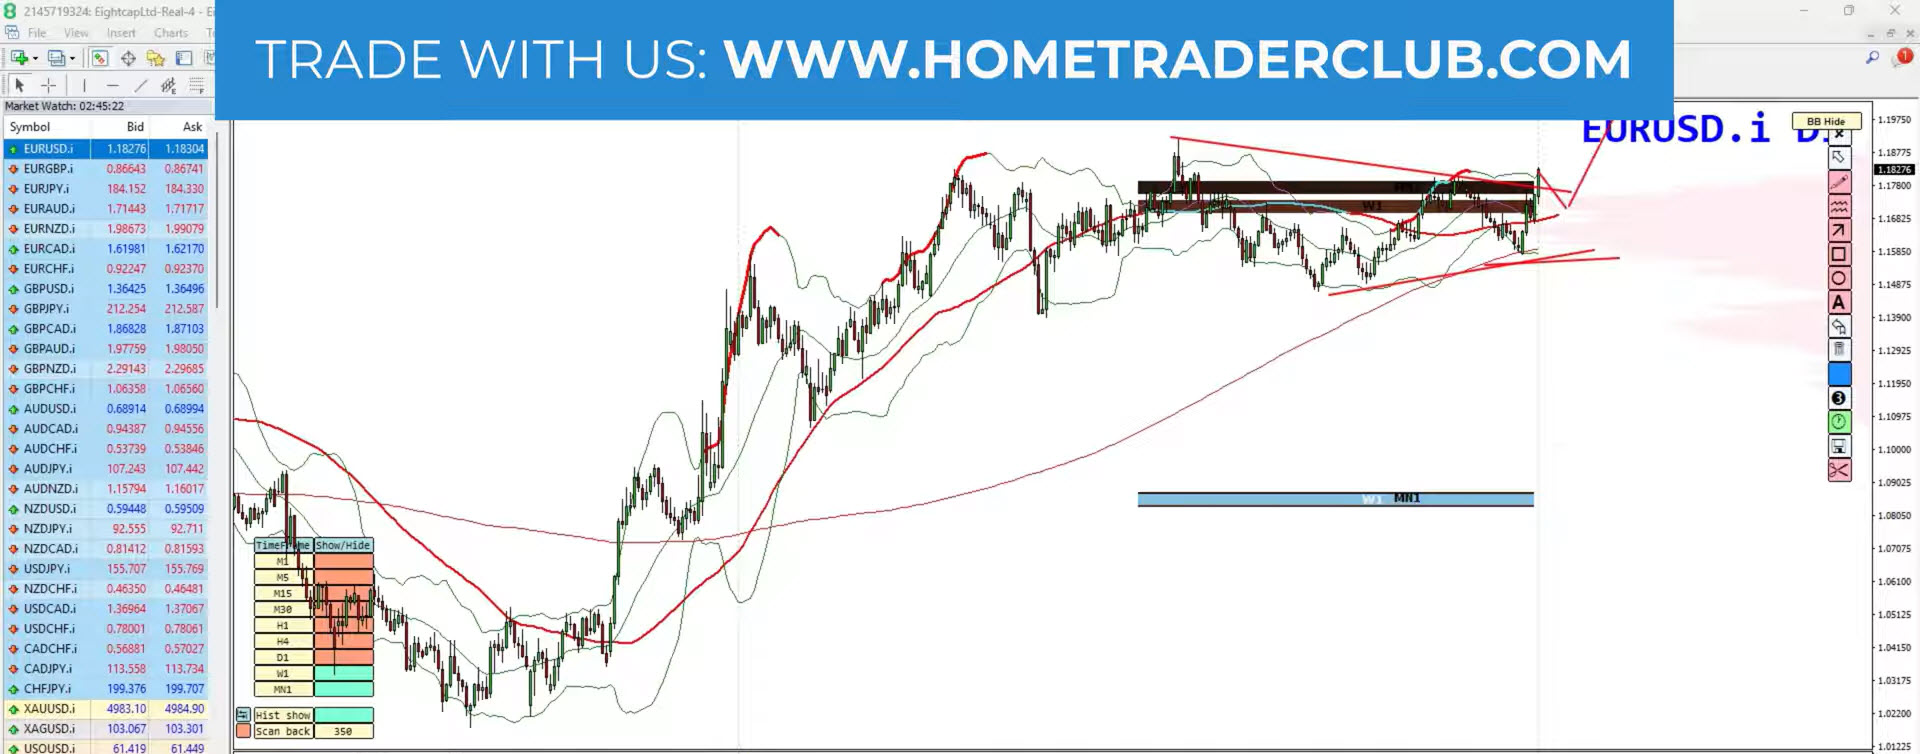
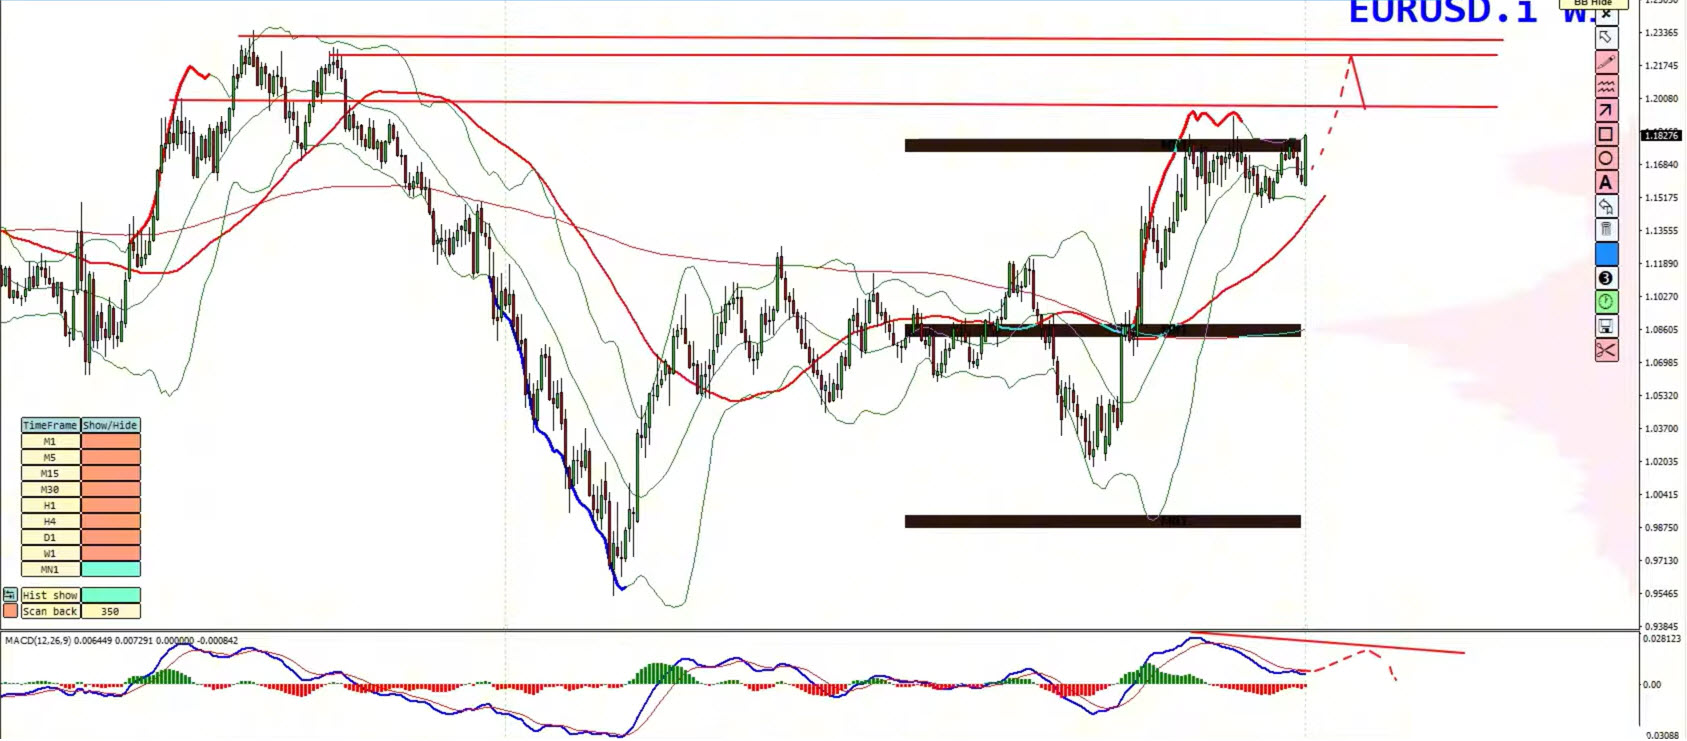
On the daily chart, EUR/USD is attempting to break out of its consolidation range. As long as recent highs remain intact, the structure favors continuation rather than reversal.
1.2000 – First major upside objective
1.2200 – Secondary resistance
1.2400+ – Final expansion zone if momentum continues
1.1575 – Key invalidation / structure support
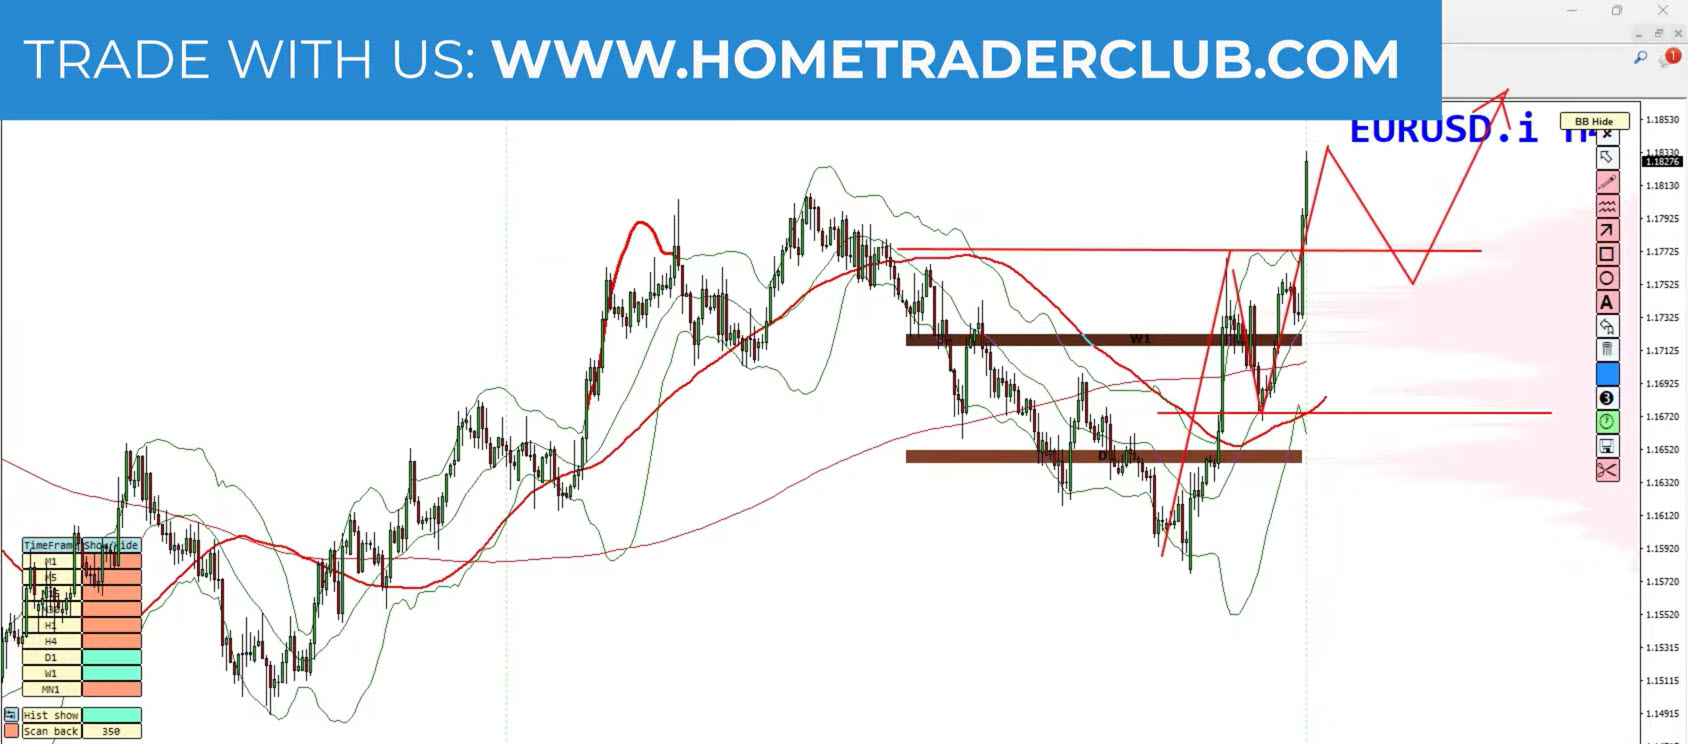
On the 4-hour chart, previous resistance has now turned into support, and the last significant low acts as a clear demand zone, where buyers previously took control.
✔ Bias: Bullish
✔ Strategy: Buy retracements, not breakouts
✔ Condition: Price must remain above 1.1575
As long as this level holds, pullbacks into support zones offer opportunities to align with the dominant trend.
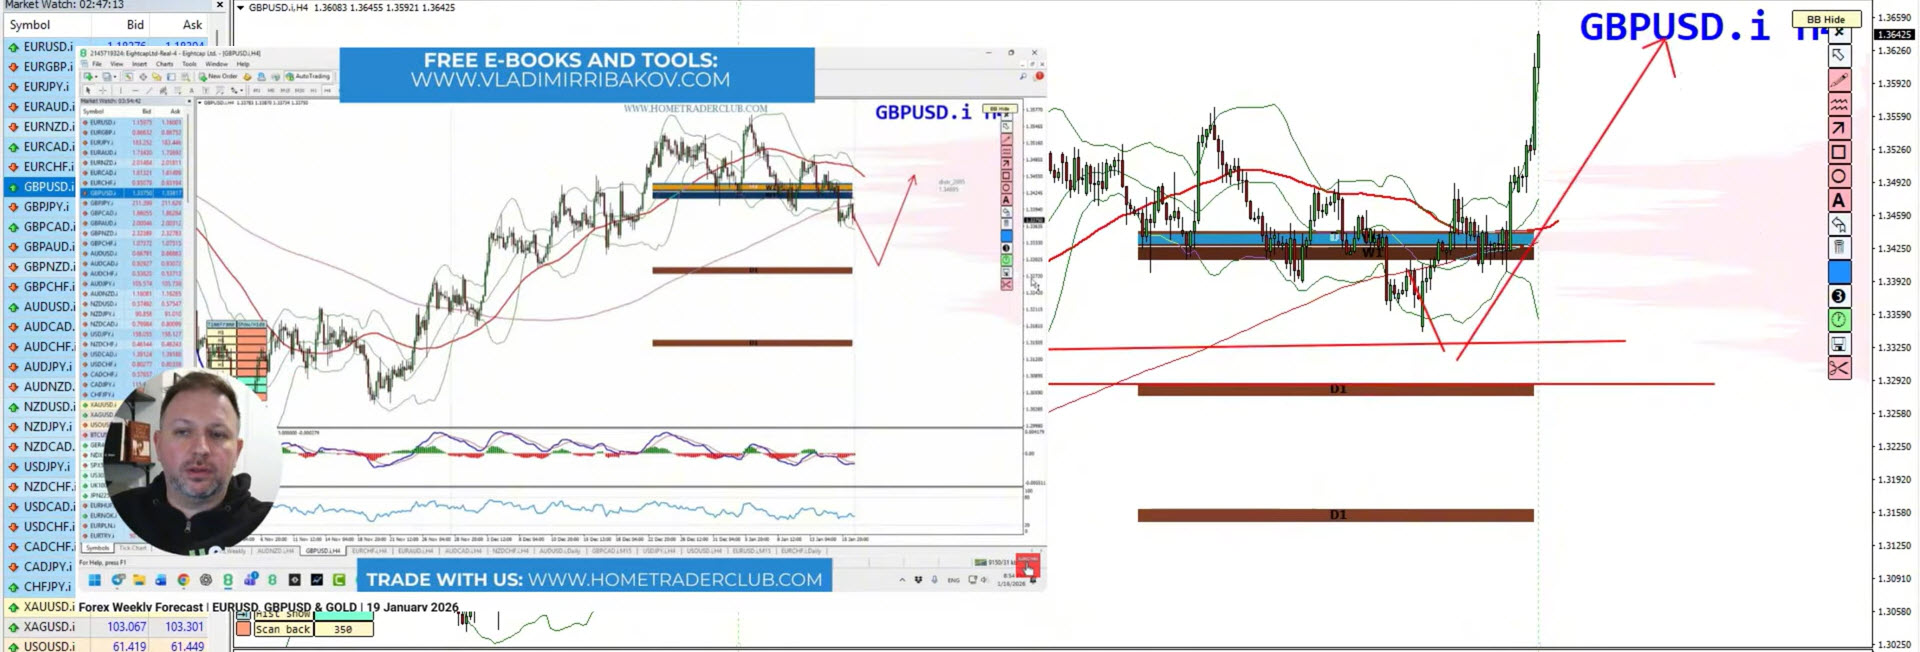
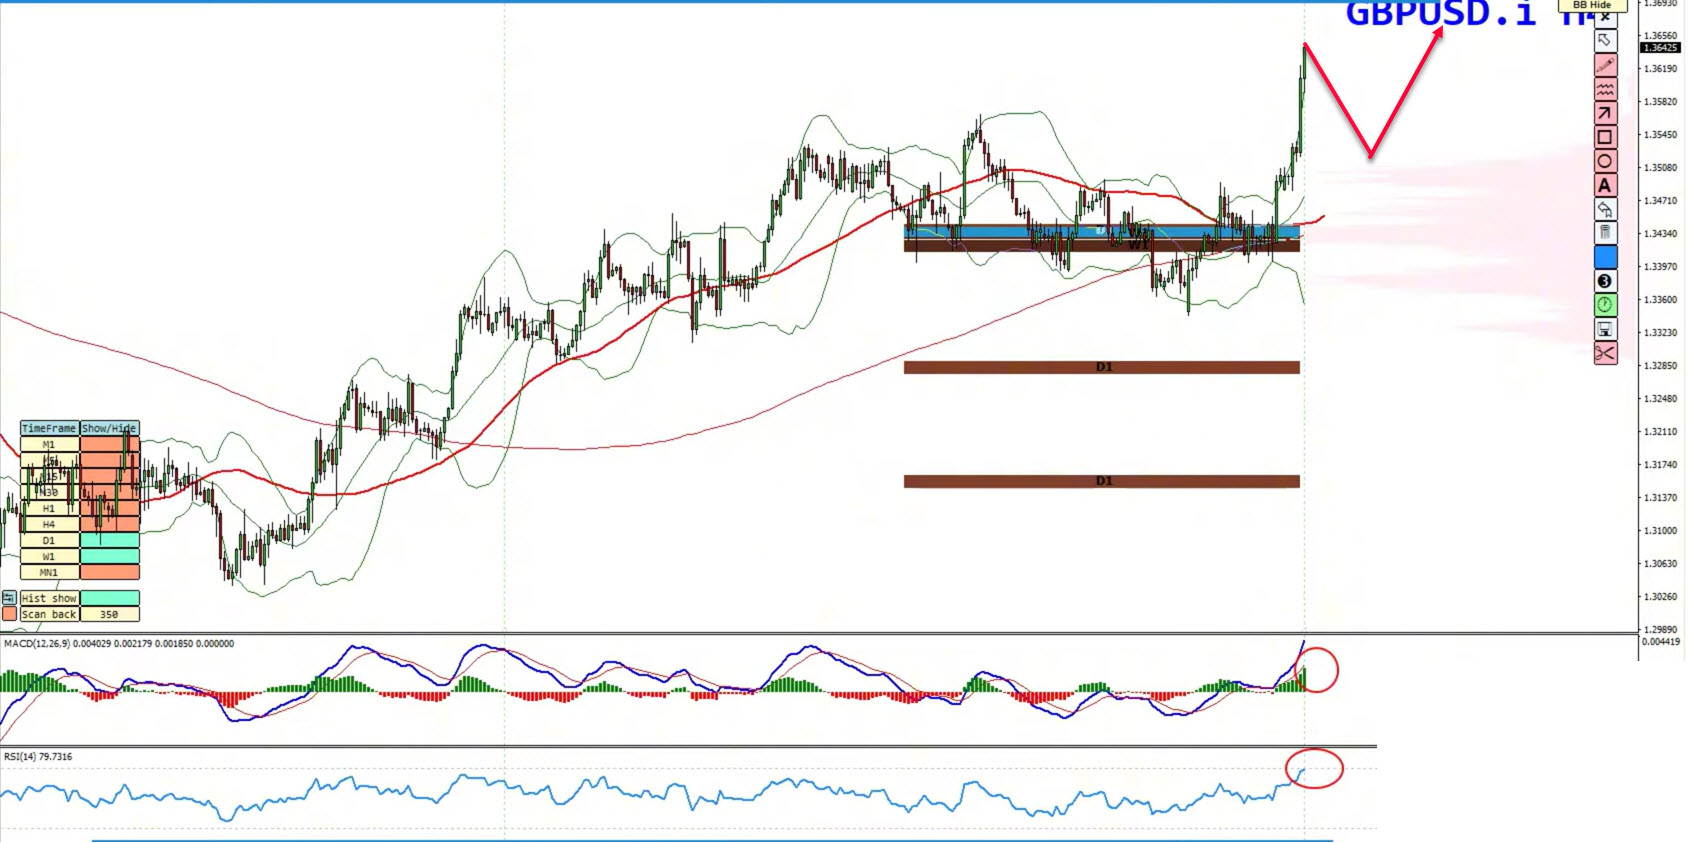
GBP/USD continues to show impressive bullish strength, exceeding last week’s expectations and pushing higher without meaningful pullbacks so far.
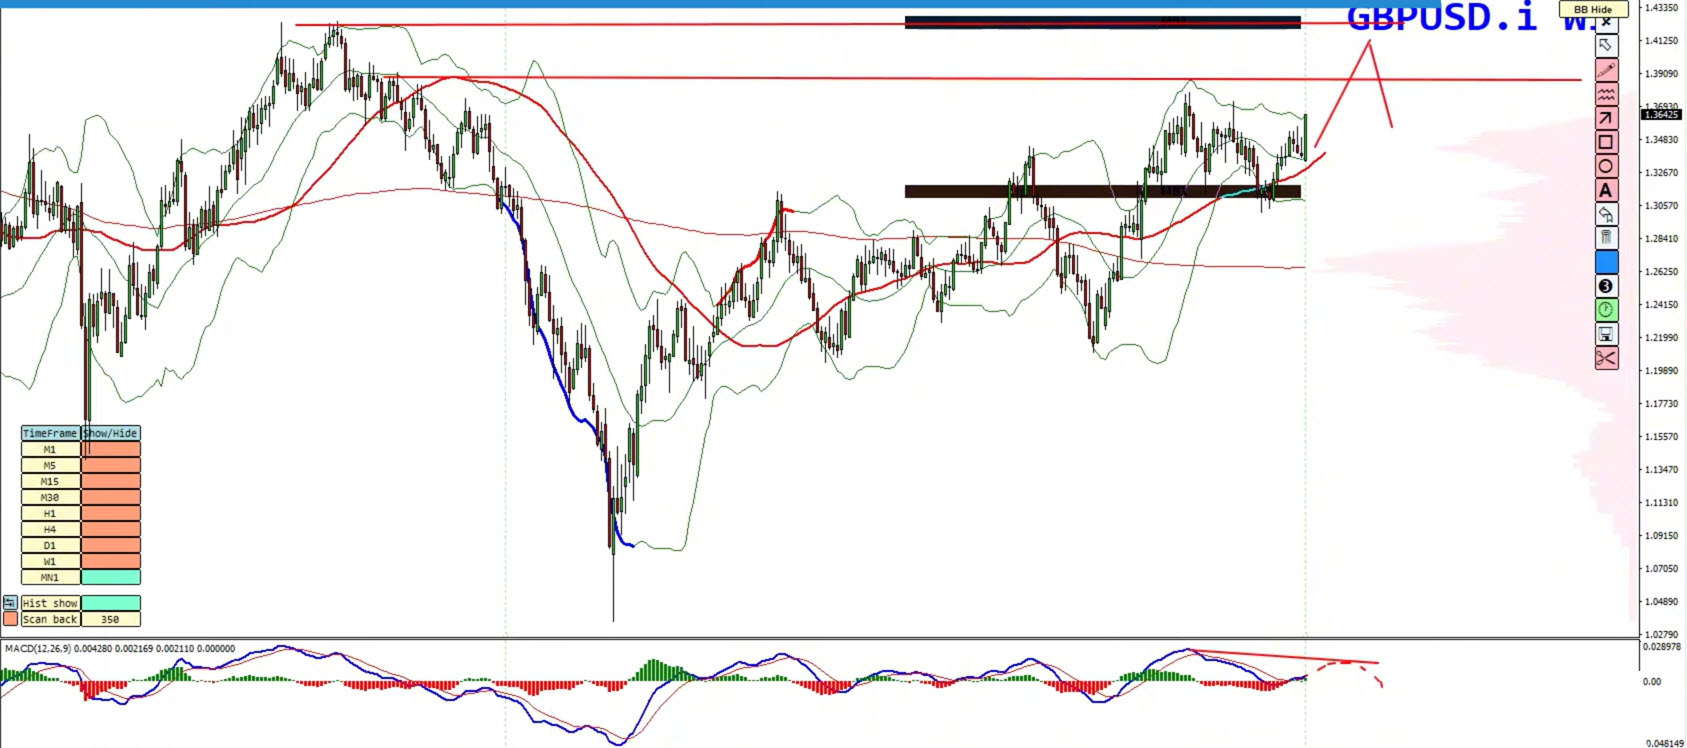
On the weekly chart, GBP/USD appears to be in a strong bullish cycle, similar to EUR/USD, with room for further upside until momentum becomes exhausted.
Potential upside resistance zones include:
1.4000
1.4200
1.4400
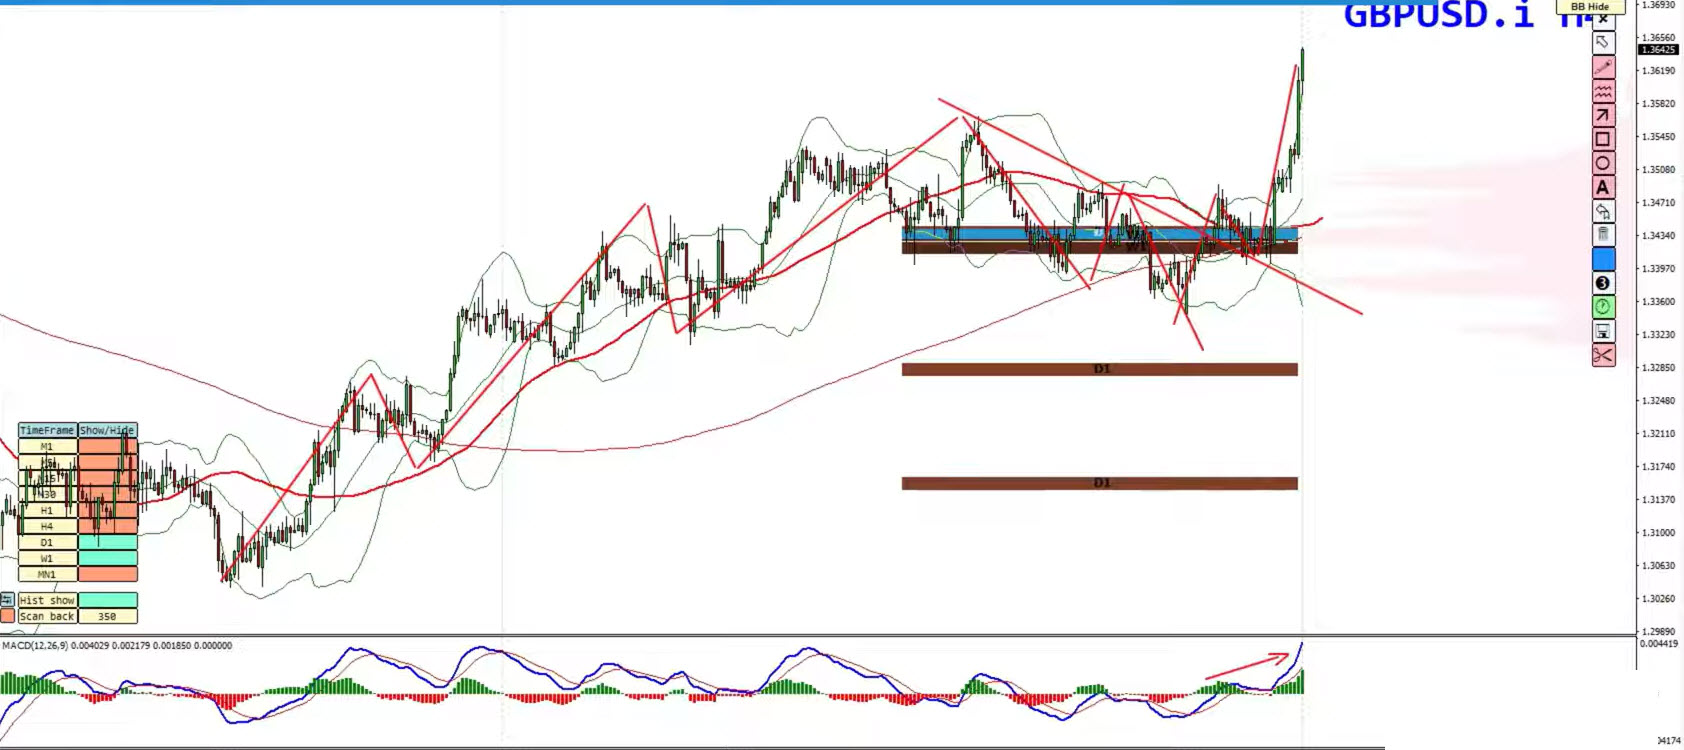
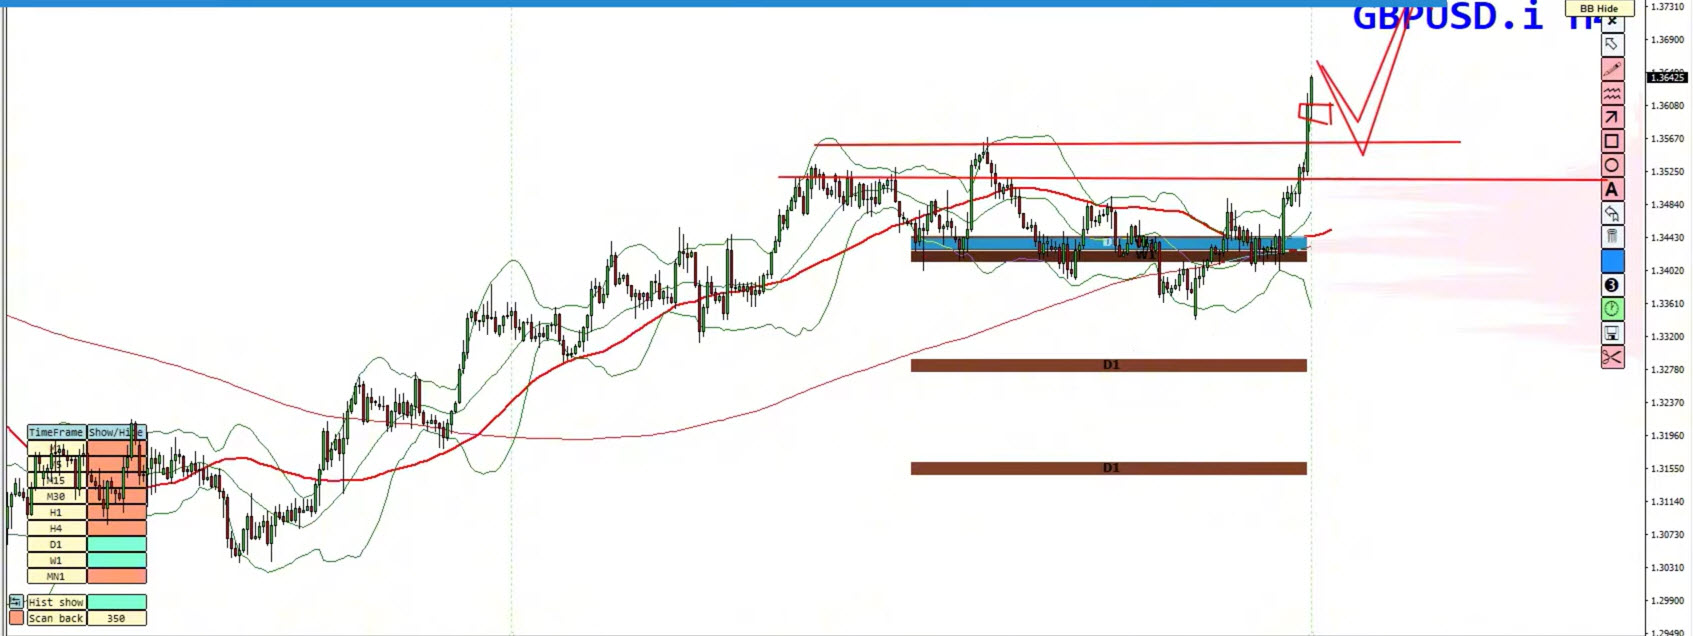
On the 4-hour chart, the structure is very clean:
Three-wave advance completed
ABCD correction already resolved
Trendline break confirmed
Higher highs on both price and indicators
RSI has moved above 80, signaling short-term overbought conditions. While this does not mean an immediate reversal, it often leads to temporary retracements — which can be constructive in strong trends.
✔ Bias: Bullish
✔ Strategy: Buy dips / retracements
✔ Focus Areas:
Broken resistance acting as support
Inner structure pullbacks
Recent swing low as invalidation
As long as higher lows remain intact, GBP/USD has technical justification to continue toward 1.40 – 1.44 and potentially beyond.
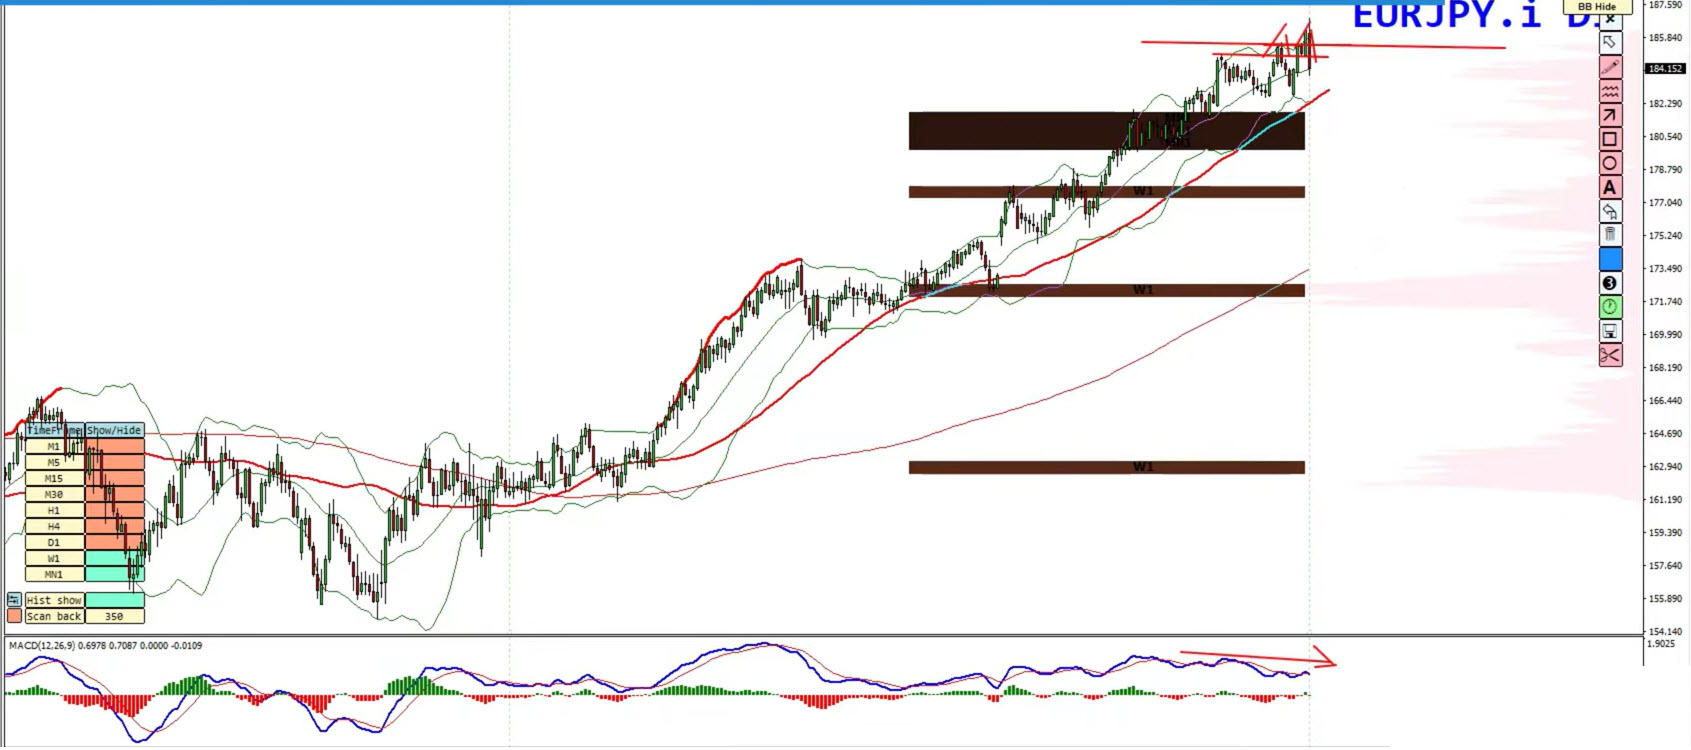
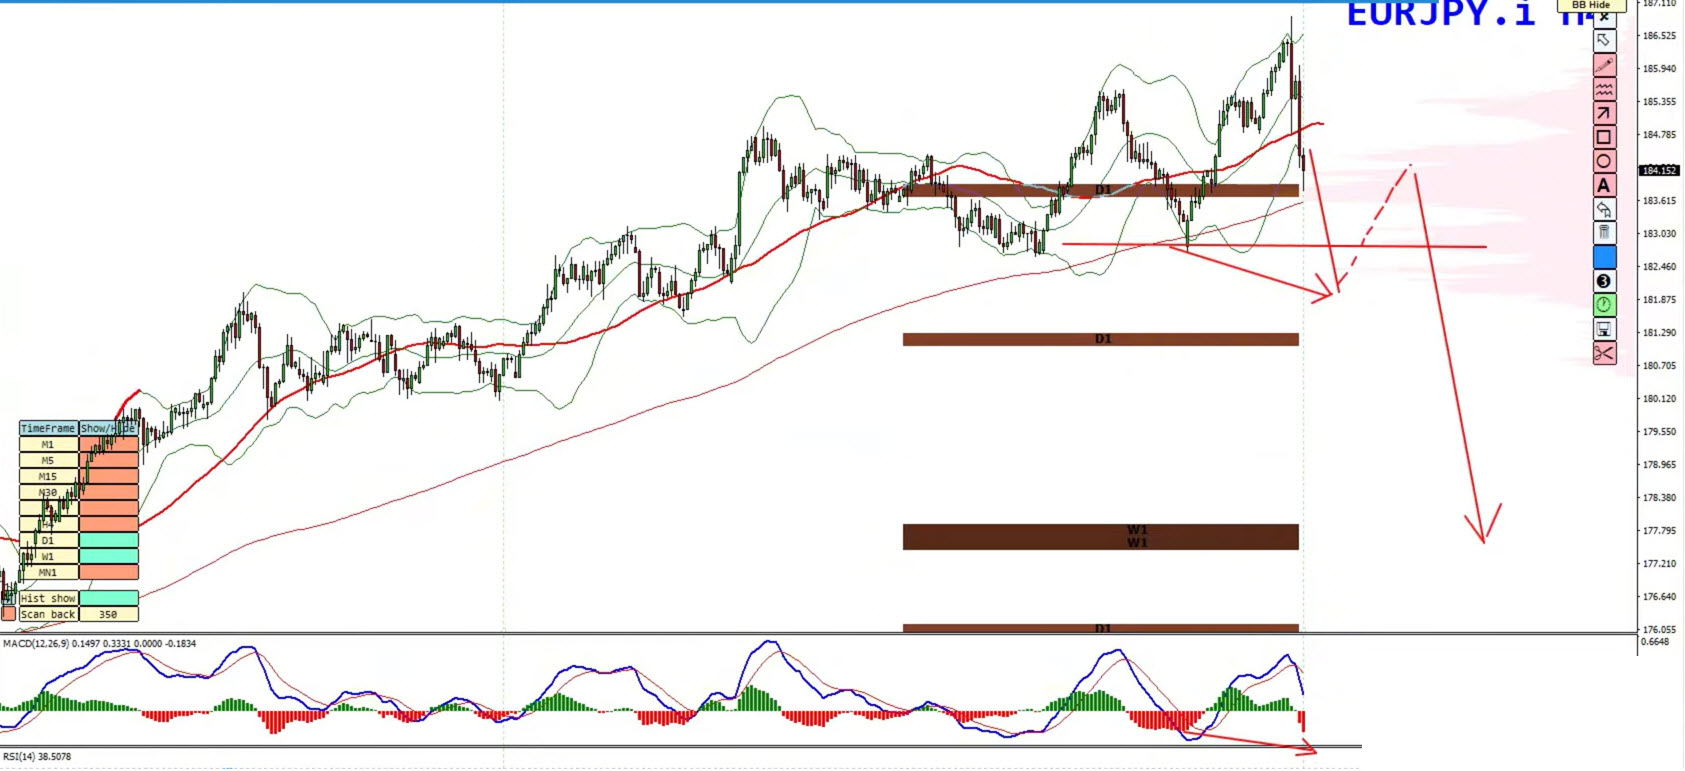
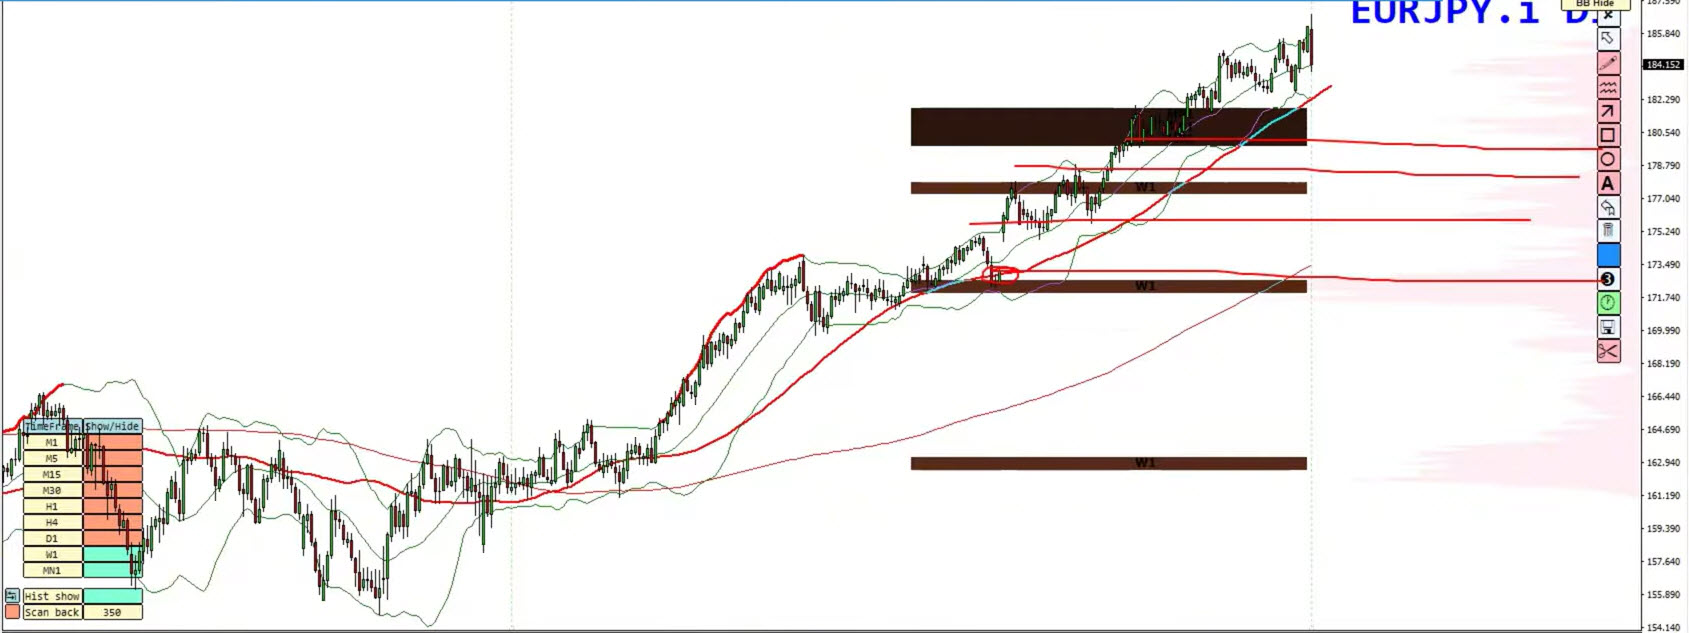
EUR/JPY presents a very different picture compared to the previous pairs.
The pair has completed two consecutive false breakouts above the 185 level, a classic warning sign of exhaustion.
Two fake highs above major resistance
Clear bearish divergence on MACD
Strong bearish engulfing candle at the top
This combination suggests distribution rather than continuation.
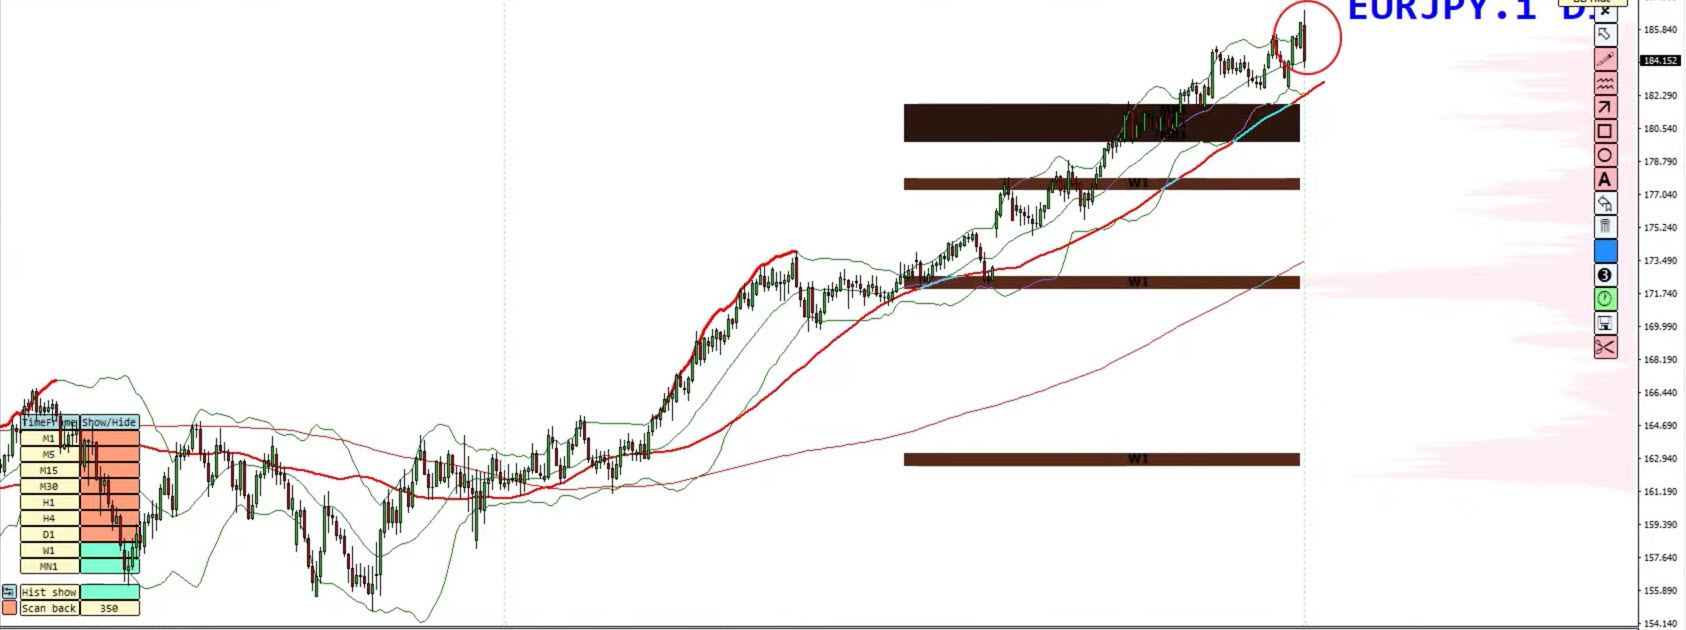
The key condition is a break below the recent swing low:
Lower lows on price
Lower lows on MACD histogram
If this occurs, the market structure shifts decisively bearish.
180.00 – First objective
178.00 – Previous structure level
175.00 – Major support zone
173.00 – Gap-fill area
Every forecast above is paired with two scenarios. Why? Because great trading is not about being right — it’s about being ready. Let the market confirm the bias. Use your system, manage risk, and execute only when the structure and confirmation align.
Want to access the tools, systems, and real-time education we use daily?
With Eight Cap Broker’s support, you can now enjoy up to one full year of access to the Home Trader Club — including:
All professional trading systems
Exclusive mentoring sessions
Real-time trade ideas and setups
Full access to our course library and trading marketplace
Wishing you a profitable week ahead!
Vladimir Ribakov
Internationally Certified Financial Technician
Home Trader Club
Welcome to this week’s Forex forecast. In this analysis, we break down the key technical…
Hi Traders! Arvinth here from the Home Trader Club team. The weekly summary and, review of April…
Stocks and bonds fell as oil surged anew, with President Donald Trump dashing optimism that the war in…
Hi Traders! GBPCAD short term forecast and technical analysis is here. We do our analysis…
Hi Traders! AUDJPY short term forecast and technical analysis is here. We do our analysis…
Hi Traders! EURJPY short term forecast update and follow up is here. On February 3rd,…