As we move deeper into December, markets are transitioning into a different rhythm. Volatility is gradually slowing, liquidity is thinning, and price action becomes more selective — yet opportunities are still very much present for those who understand market structure and timing.
Before we dive in, a big thank you to our partners at Eight Cap Broker for supporting our community.
You can continue enjoying all the exclusive offers we have together with them — including up to one full year of free access to Home Trader Club, all our trading systems and tools, private mentoring sessions, and much more.
? Check out the exclusive offers via the link below the video or on vladimirribakov.com
Let’s break down this week’s key instruments: EURUSD, USDJPY, Gold, and Bitcoin, combining higher-timeframe structure with tactical execution zones.
The major macro driver over the past weeks was the Federal Reserve rate cut, along with subtle but important signals suggesting further easing could follow in early 2026.
Markets reacted accordingly:
Risk sentiment improved
The US dollar weakened broadly
Anti-dollar pairs gained momentum
From a technical standpoint, this shift aligns well with what price structure has already been communicating.
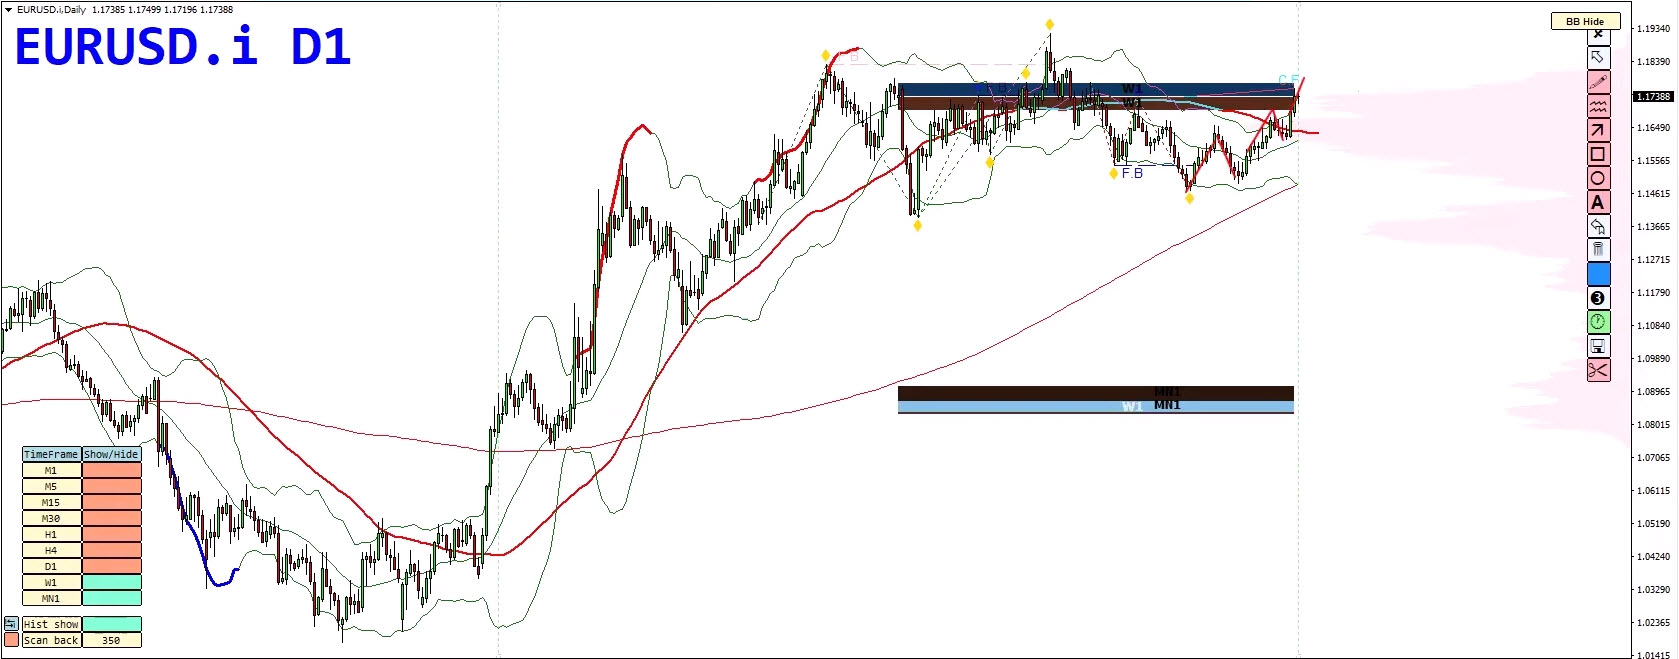
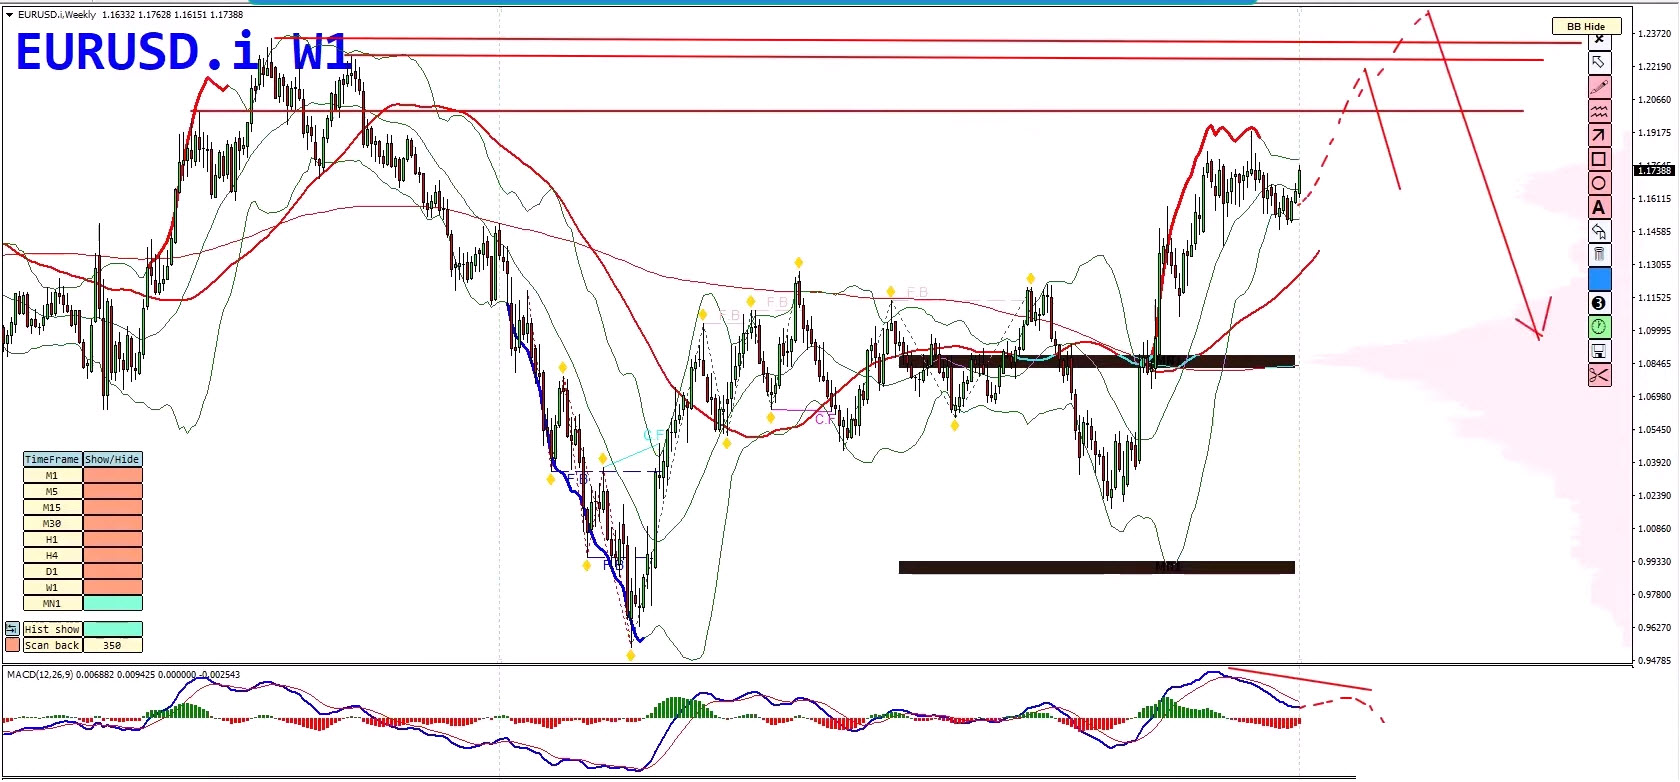
In previous forecasts, we outlined two primary scenarios for EURUSD:
A return to higher highs and higher lows, signaling bullish continuation
A breakdown below the range toward 1.1140–1.1110 before any new trend
Scenario one has clearly played out.
Weekly structure remains bullish
Price is trending cleanly with no bearish divergences
The broader weekly cycle has not yet completed
From a cycle perspective, EURUSD still has room to push higher — potentially toward 1.2000, and more realistically 1.2200–1.2400, before sellers regain control.
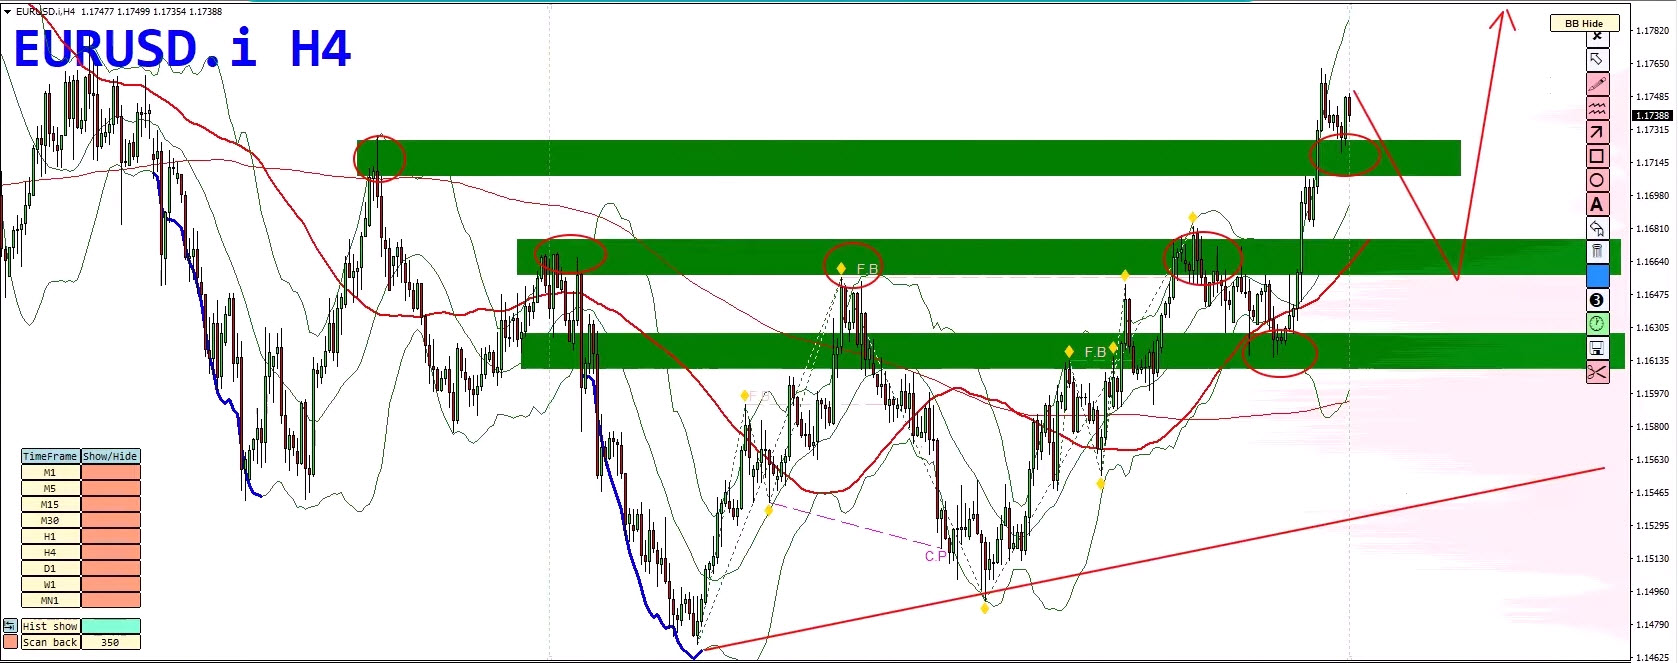
As long as price holds above these levels, the bullish structure remains intact:
Broken resistance acting as support
1.1670 area (clustered former resistance)
1.1610–1.1620 (last major higher low + trendline confluence)
Bias: Buy retracements
Execution: Wait for price rejection, not blind entries
Momentum and structure strongly favor buyers
Market snapshot data supports this view, with EURUSD showing solid gains over the 1-month and 7-day periods, confirming buyer control.
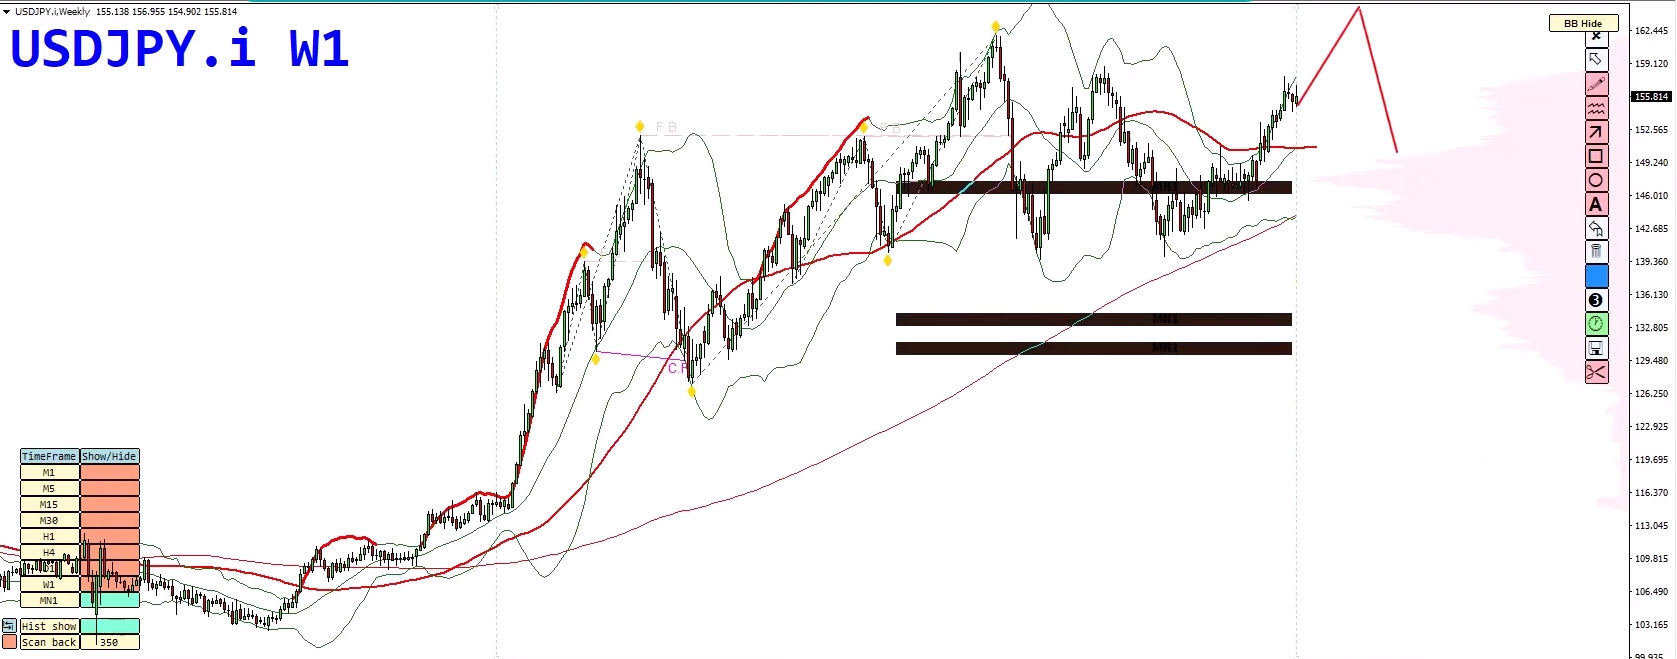
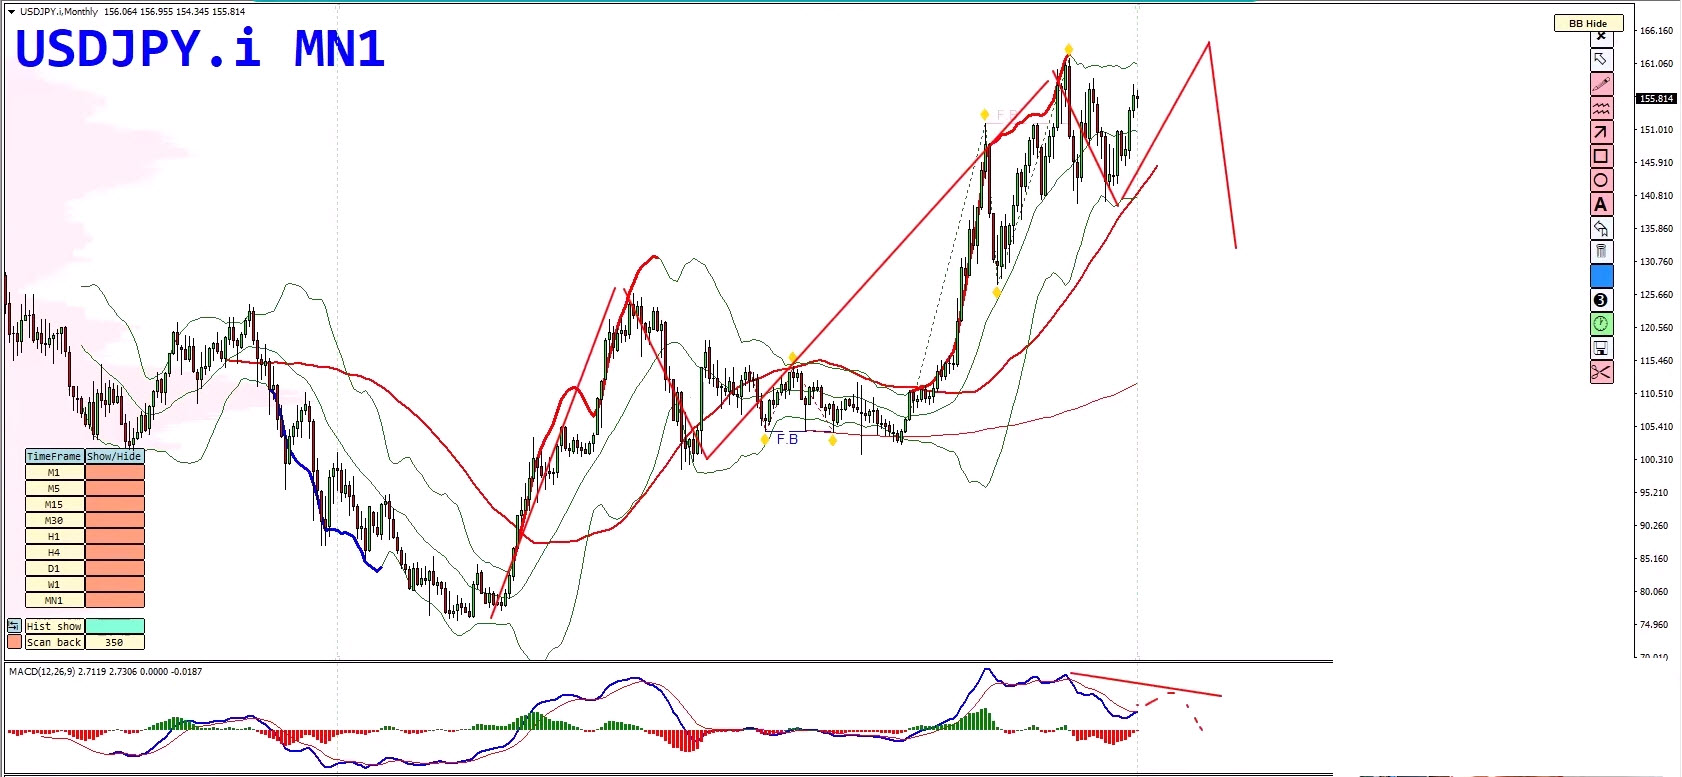
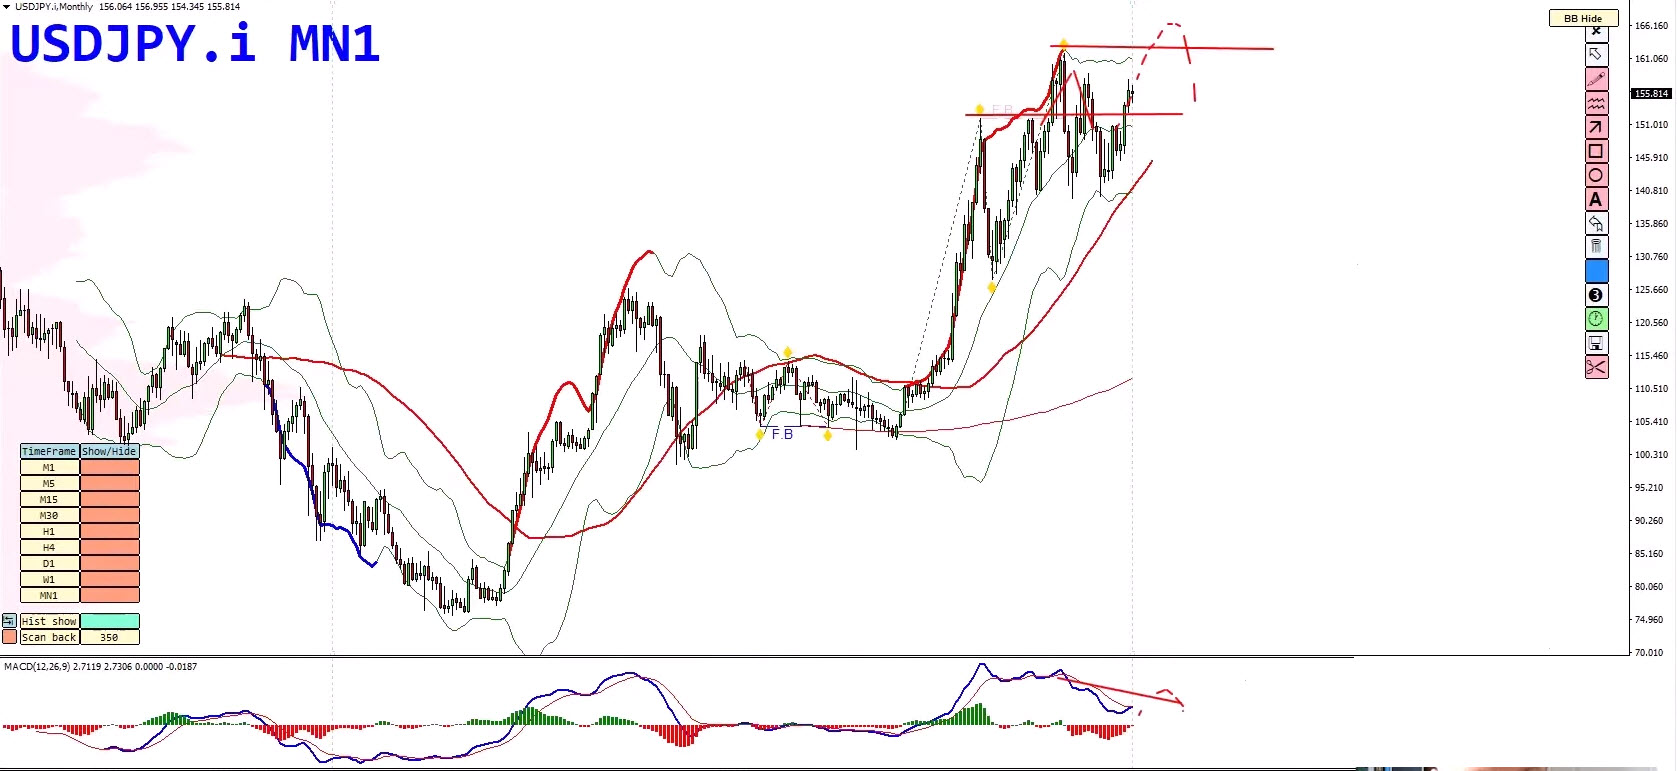
Despite political changes in Japan and ongoing speculation around policy shifts, USDJPY continues to respect its bullish technical structure.
Long-term structure remains intact
No confirmed trend reversal on weekly or monthly charts
A multi-wave expansion into 2026 remains technically valid
Even the previous false breakout did not produce a structural shift — an important signal of underlying strength.
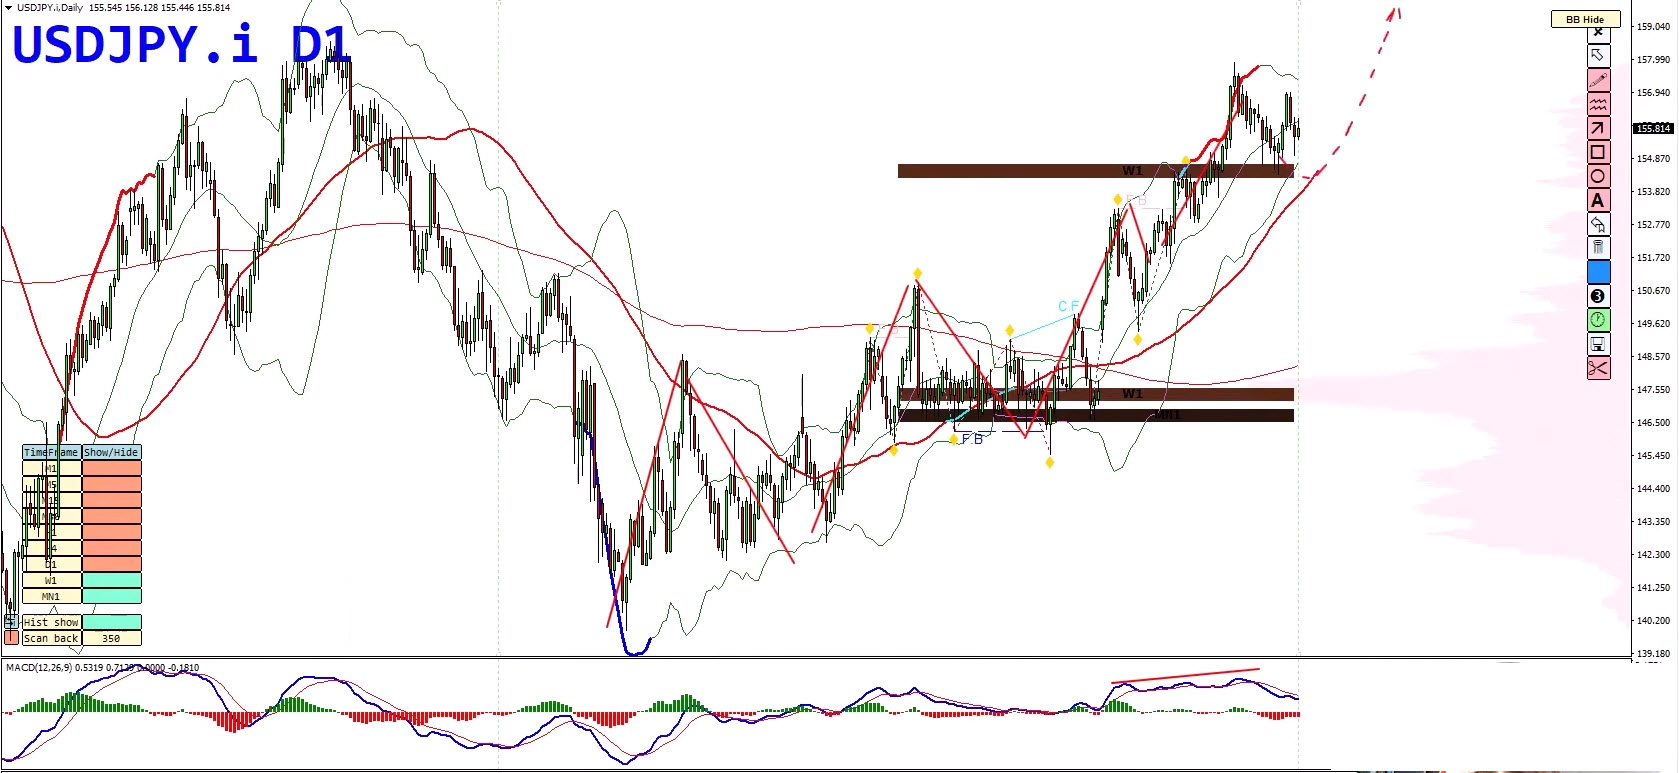
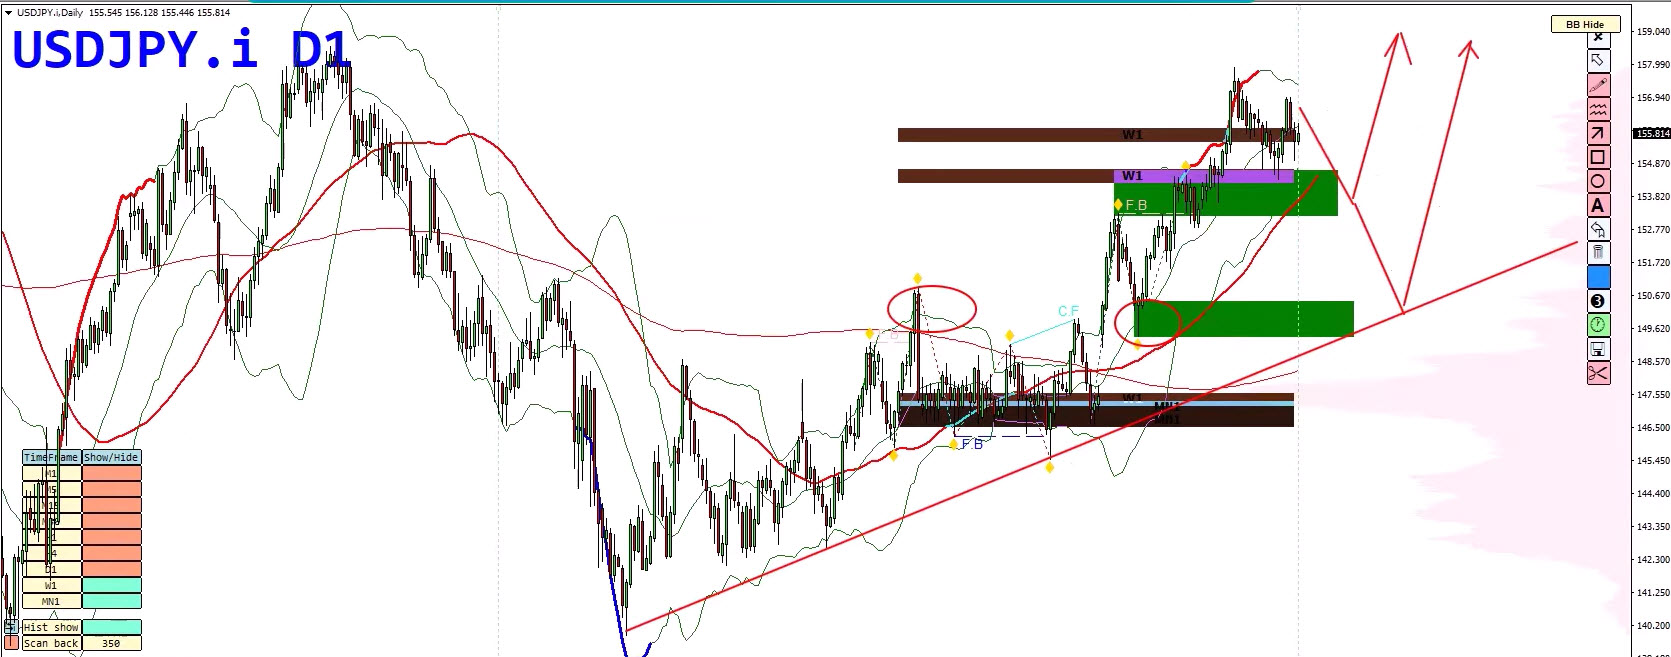
As long as these levels hold, the strategy remains unchanged:
154.00–154.50 (broken resistance turned support)
150.00 area (daily structure low + rising trendline)
Bias: Buy dips
Confirmation: Look for clear rejection near support
Avoid emotional chasing — patience matters
Broad market metrics continue to show buyers in control despite short-term fluctuations.
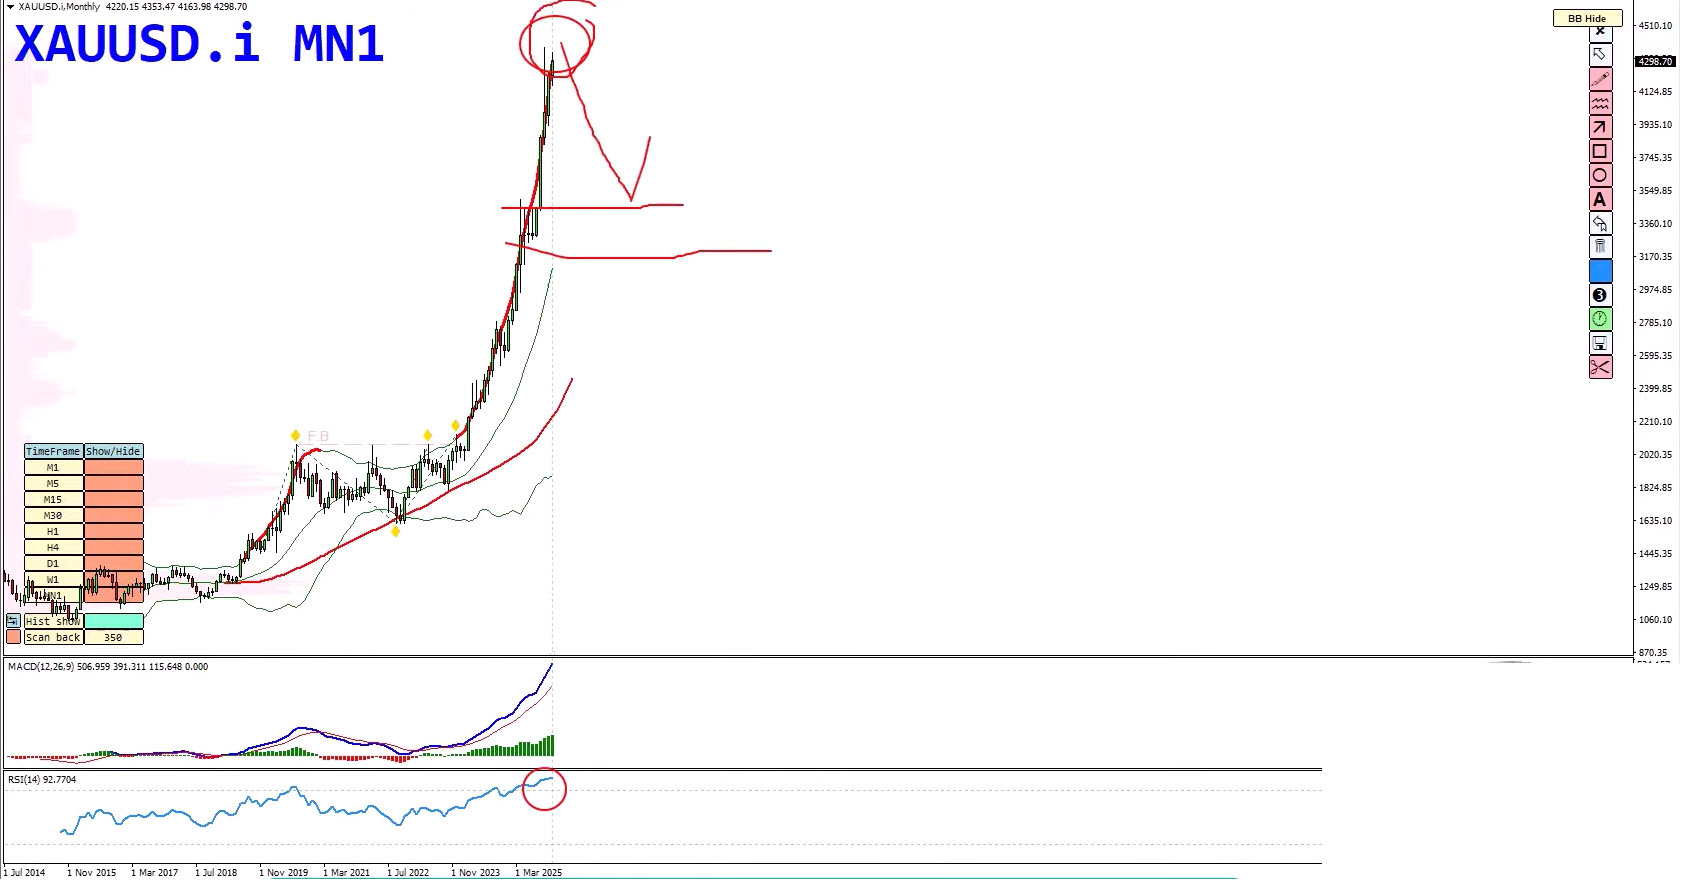
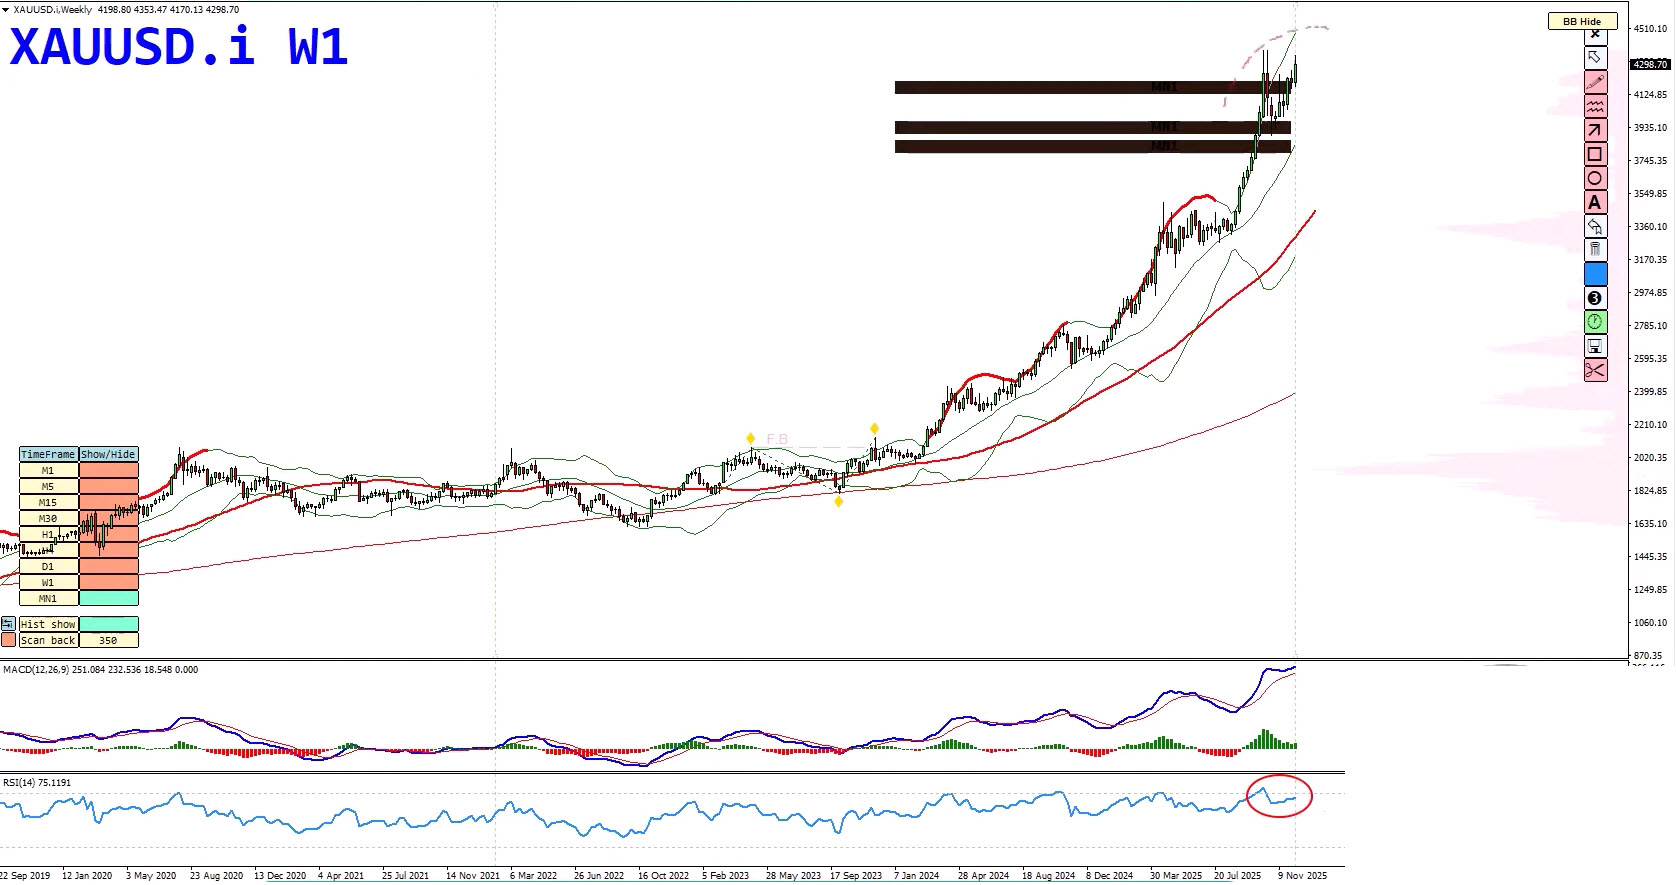
Gold remains in extreme overbought territory on higher timeframes. However, overbought does not mean immediate reversal — a common mistake among traders.
Monthly and weekly charts signal exhaustion
Price is slowing, suggesting peak formation, not collapse
A deeper correction toward 3500 or even 3300 remains likely once the peak completes
This process often unfolds gradually — rounding tops, divergences, false breakouts — before the real move begins.
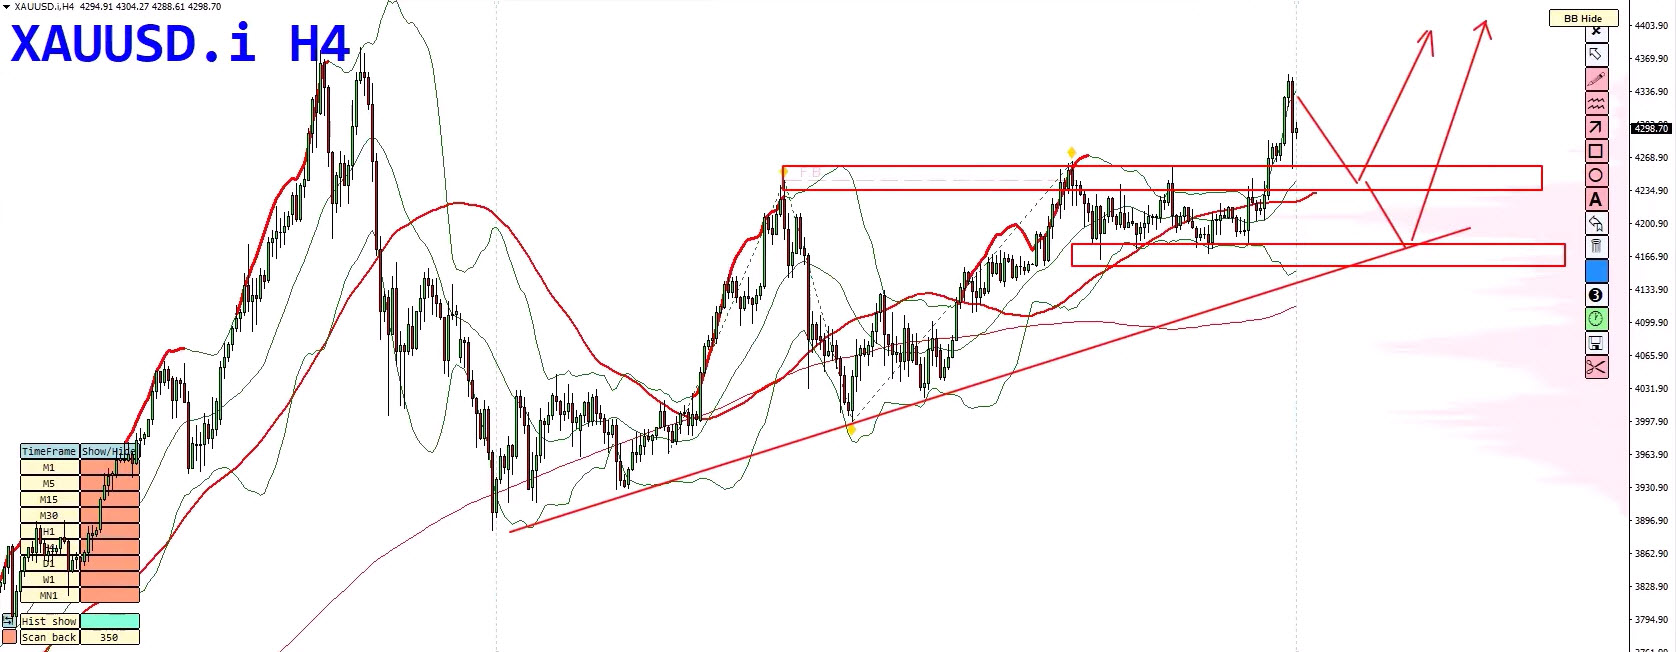
As long as structure holds:
Broken resistance at 4250–4230
Rising trendline
Demand zone around 4200
➡ Buy retracements only with confirmation
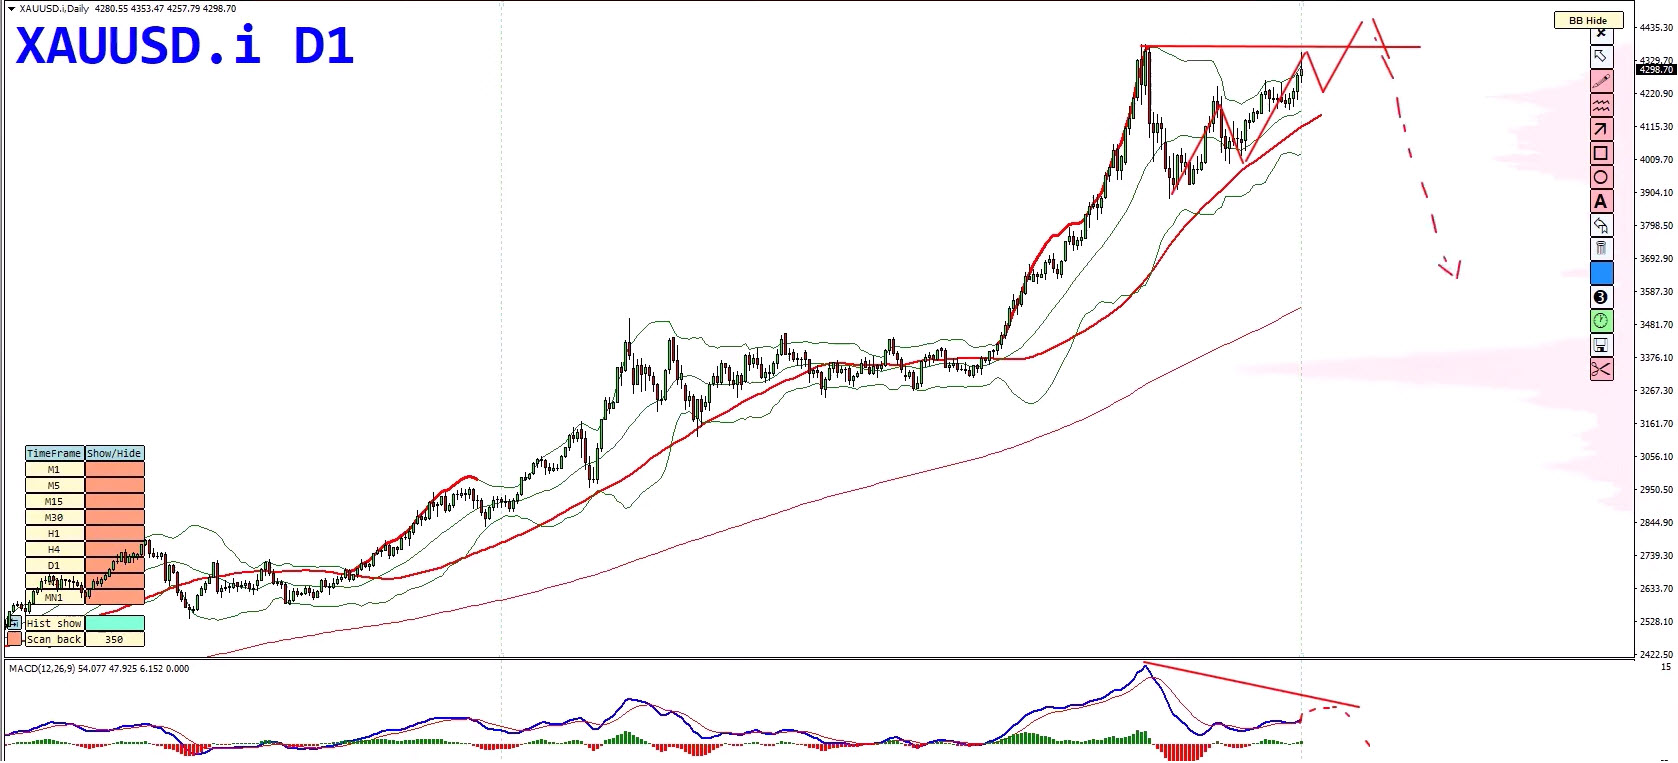
For a sell scenario, we want to see:
A final higher high
Daily bearish divergence
Failed breakouts signaling seller entry
This setup is more likely to mature into 2026, especially with holiday liquidity fading.
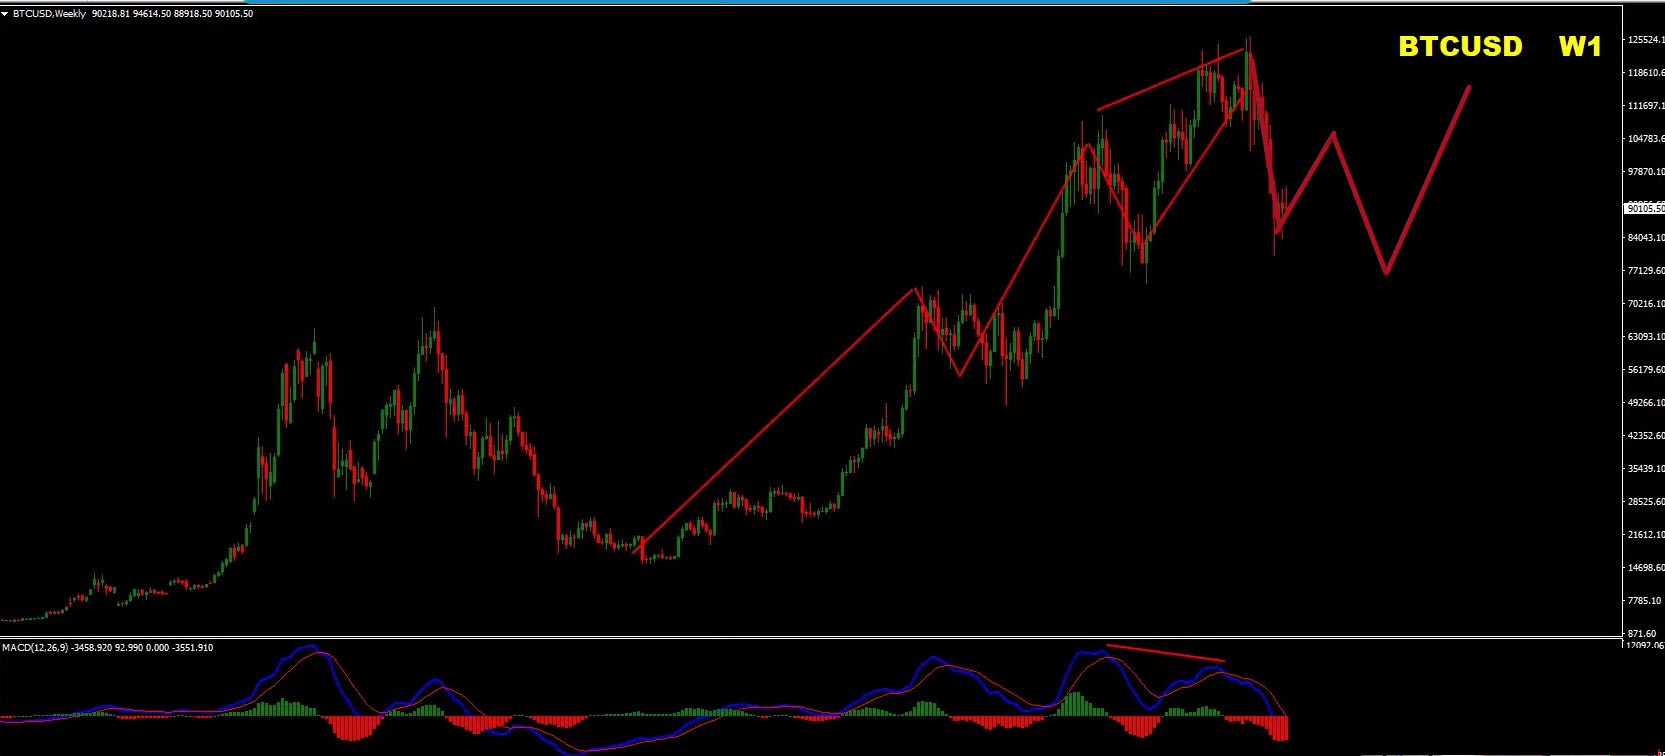
Bitcoin remains one of the most misunderstood markets at this stage. While optimism dominates headlines, technical structure tells a more cautious story.
Weekly cycle suggests a corrective phase
Bearish pressure has not fully played out
Bias remains: Sell rallies
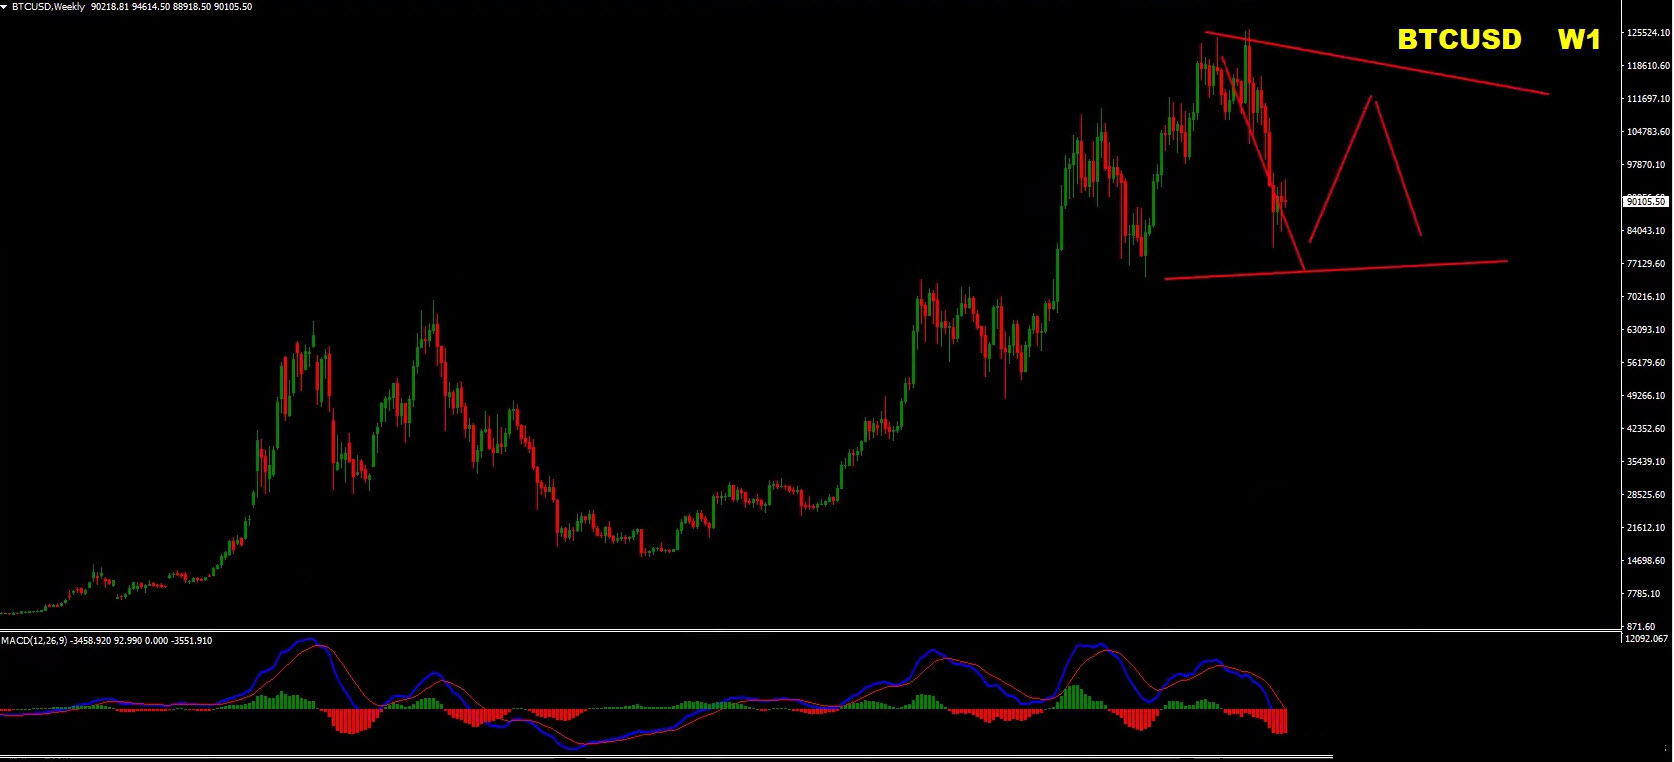
This does not mean straight-line downside — corrections could be in the form of double wave down.
Or in the form of a range
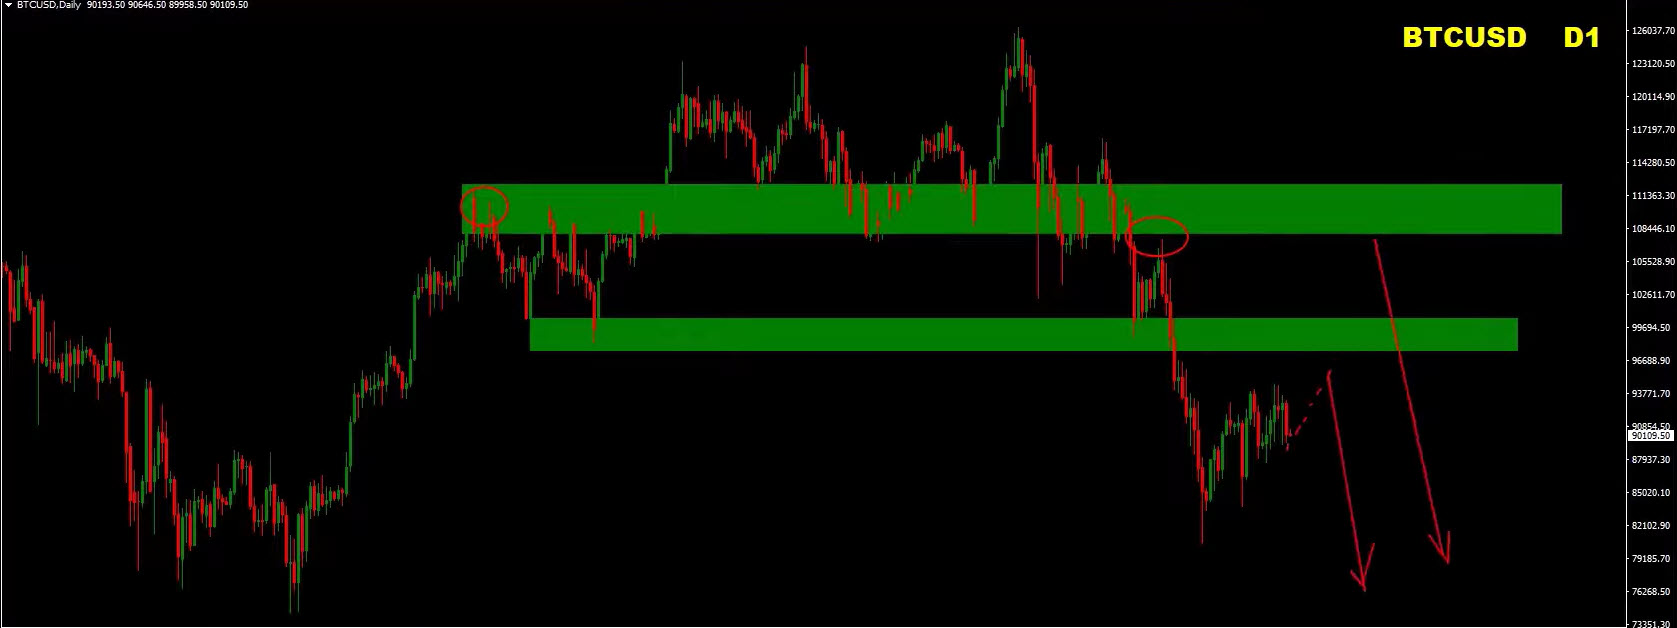
100,000 (psychological + structural resistance)
108,000–112,000 (previous seller control zone)
Rallies into these areas are likely to face renewed selling pressure.
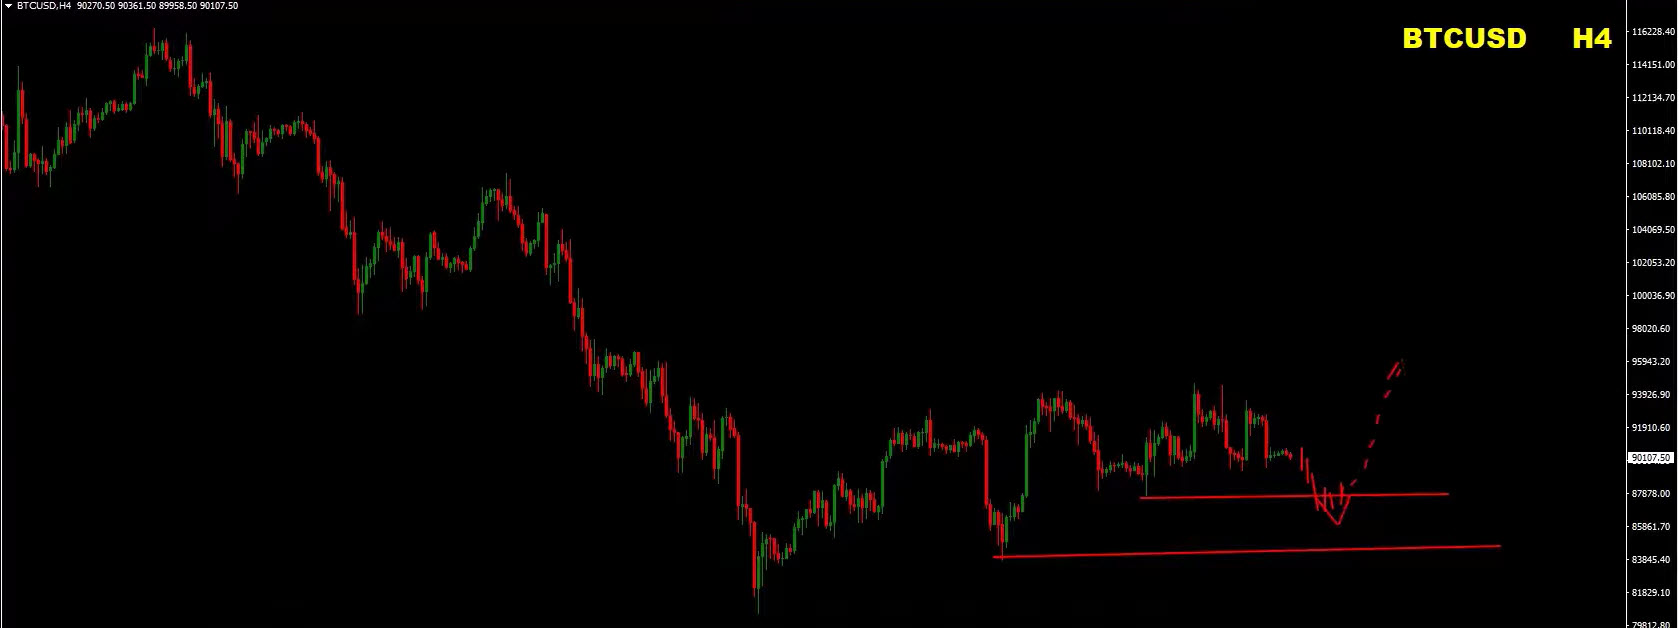
For tactical, short-term trades:
88,000
85,000
These levels may offer temporary rebounds, but they are counter-trend trades and require strict risk control.
Every forecast above is paired with two scenarios. Why? Because great trading is not about being right — it’s about being ready. Let the market confirm the bias. Use your system, manage risk, and execute only when the structure and confirmation align.
Want to access the tools, systems, and real-time education we use daily?
With Eight Cap Broker’s support, you can now enjoy up to one full year of access to the Home Trader Club — including:
All professional trading systems
Exclusive mentoring sessions
Real-time trade ideas and setups
Full access to our course library and trading marketplace
Wishing you a profitable week ahead!
Vladimir Ribakov
Internationally Certified Financial Technician
Home Trader Club
Welcome to this week’s Forex forecast. In this analysis, we break down the key technical…
Hi Traders! Arvinth here from the Home Trader Club team. The weekly summary and, review of April…
Stocks and bonds fell as oil surged anew, with President Donald Trump dashing optimism that the war in…
Hi Traders! GBPCAD short term forecast and technical analysis is here. We do our analysis…
Hi Traders! AUDJPY short term forecast and technical analysis is here. We do our analysis…
Hi Traders! EURJPY short term forecast update and follow up is here. On February 3rd,…