Hello traders! I’m Vladimir Ribakov from the Home Trader Club, and I’m excited to present this week’s Forex Weekly Forecast for July 14-18, 2025. As always, a big thanks to Eight Cap for supporting our trading community. With Eight Cap, you can enjoy exclusive access to the Home Trader Club, full access to all our trading tools, semi-automated systems, and even private mentoring sessions with me. Check out the link in the description below for more details.
For more details, visit: Home Trader Club Mentorship Program
Click the link below to watch the forecast video on YouTube
Don’t forget to Like, Comment, and Subscribe for more weekly plans and real-time insights.
As an Internationally Certified Financial Technician (CFTe, IFTA) and former private capital hedge fund trader, I have successfully mentored numerous students who are now thriving in the trading world. Students who learned with me, are now full-time traders, work in the trading industry, run their own capital firms or are fully funded traders by private companies, develop automated trading solutions and manage others’ capitals. I am a very proud mentor and I am proud of the success stories I’ve helped create, and for a limited time, I’m offering my mentorship program for free through a partnership with Eight Cap broker. Join Eight Cap, become an active trader, and choose the offer that suits you best –
For more details, visit: Home Trader Club Mentorship Program
I’m excited to work with you and help you reach your desired level of success!
Let’s dive into the charts and explore this week’s trade setups for EUR/USD, GBP/USD, USD/JPY, and Gold (XAU/USD).
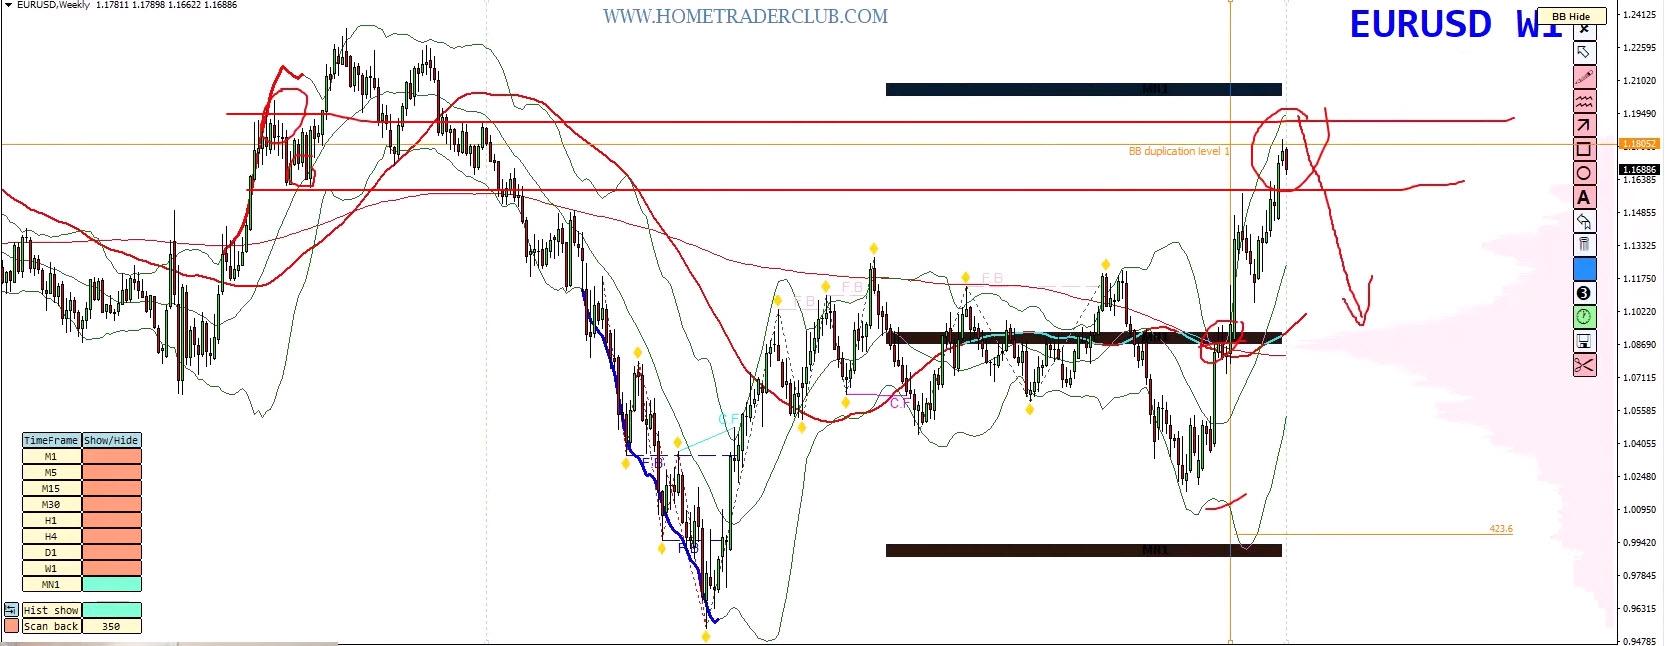
Last week, we anticipated downside potential for the Euro, and now we’re seeing price reacting near key resistance zones.
? Weekly Chart Insights:
Our custom Bollinger Band shows the price stalling around the supply zone (last high + broken support), creating strong short-term resistance.
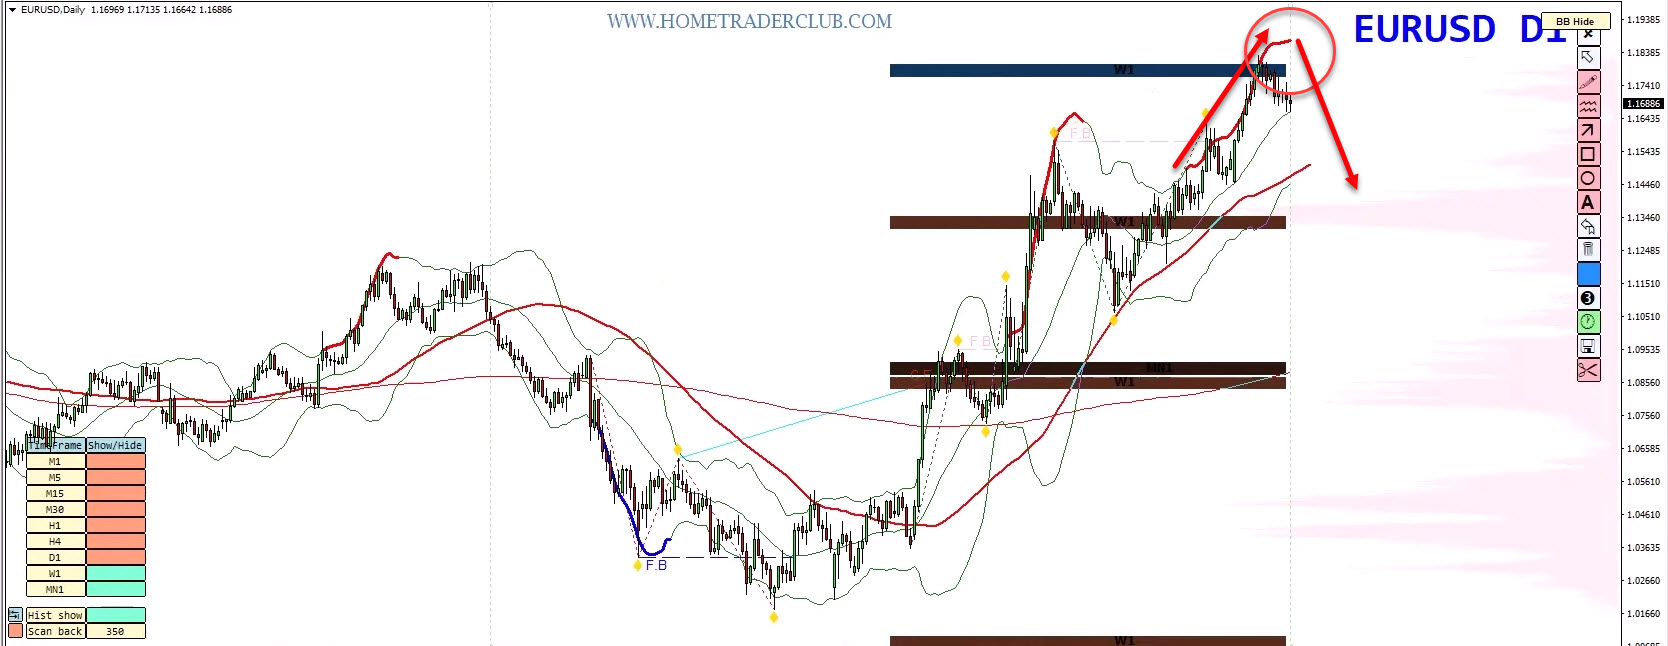
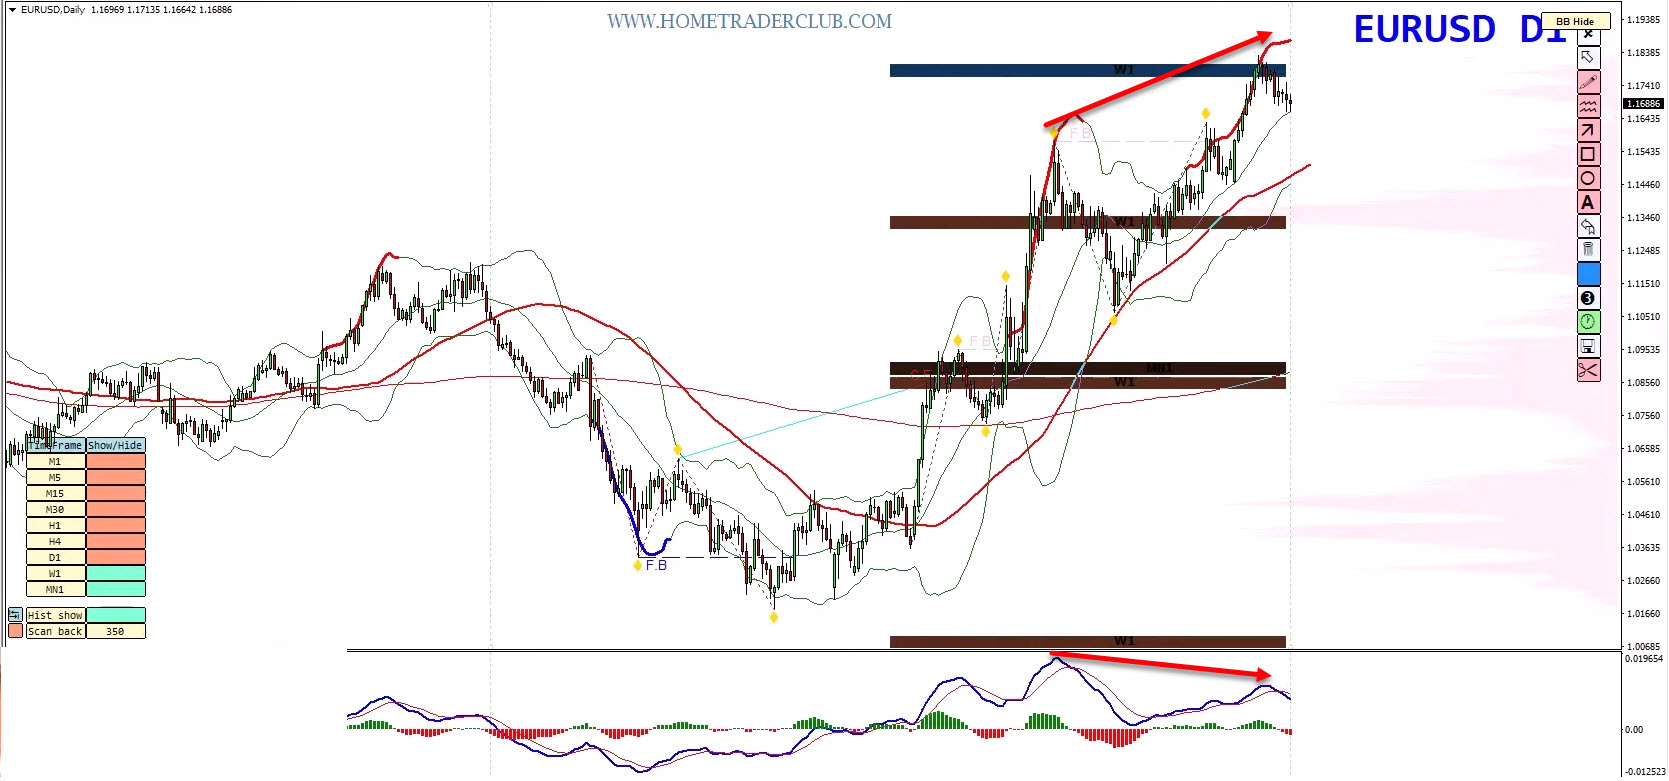
On the daily chart, price has been riding the upper Bollinger Band for over 20 candles—a historical signal of exhaustion.
? MACD Bearish Divergence is in place, increasing the probability of a downside reversal.
? Key Zones to Watch:
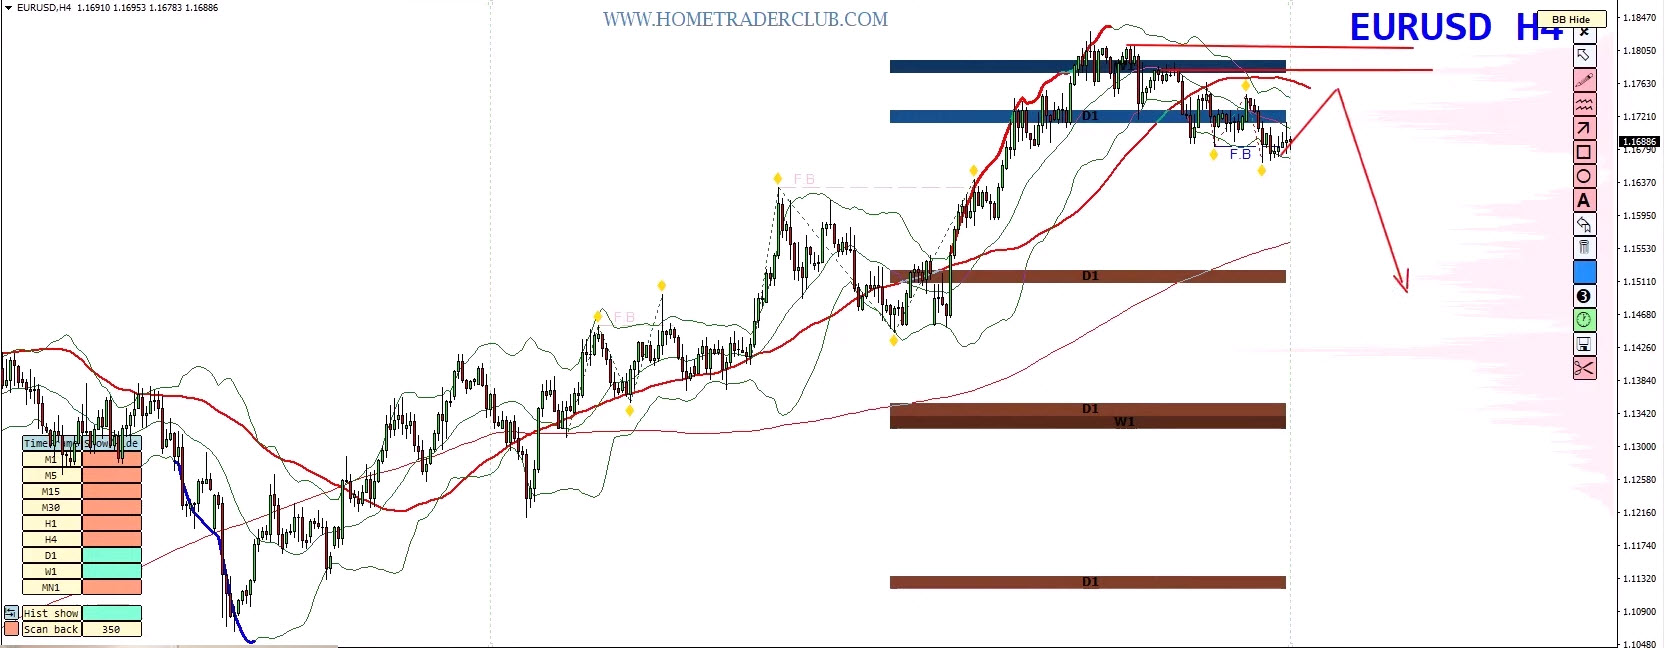
Resistance: 118.10–117.70
If this area holds, potential targets lie at 1.1600, 1.1450, or even lower.
If price breaks higher, expect one final push toward 119.00–121.00 before reversal.
? Market Momentum Snapshot:
Monthly: Down from over +3% to shrinking
7-Day: -1%
Indicates buyers losing control—supports the bearish view
✅ Strategy: Watch for retracements to the supply zone for potential short opportunities.
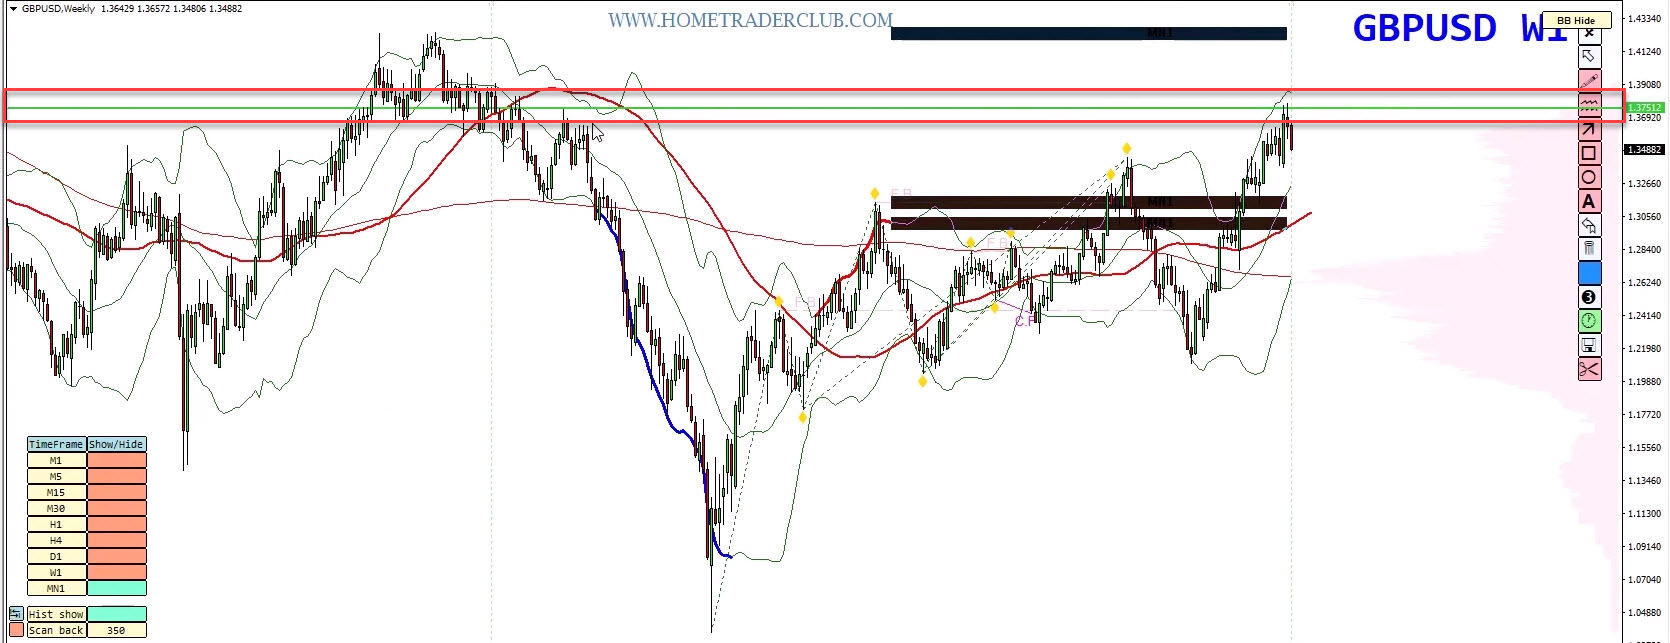
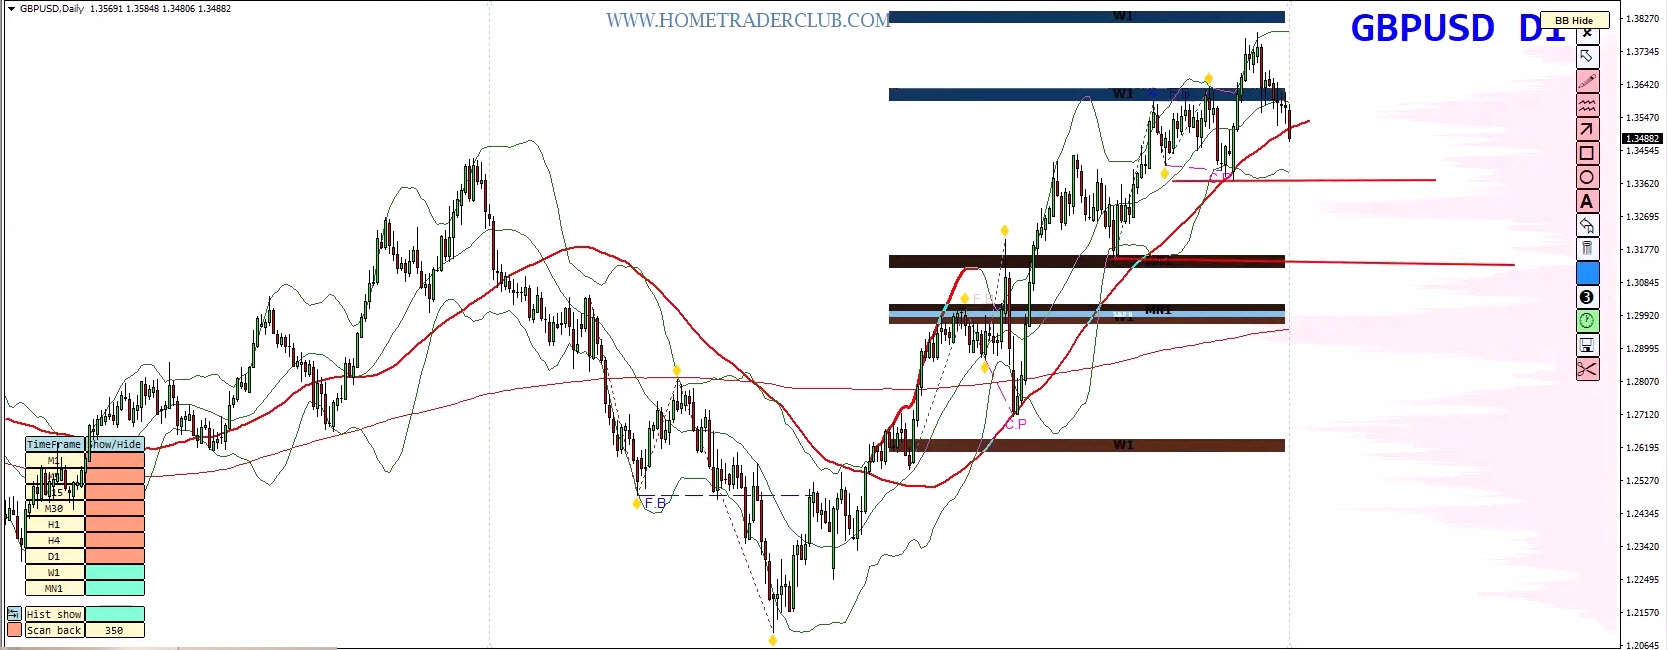
The Pound is echoing the Euro’s behavior with clean rejection from a major supply level near 1.3750.
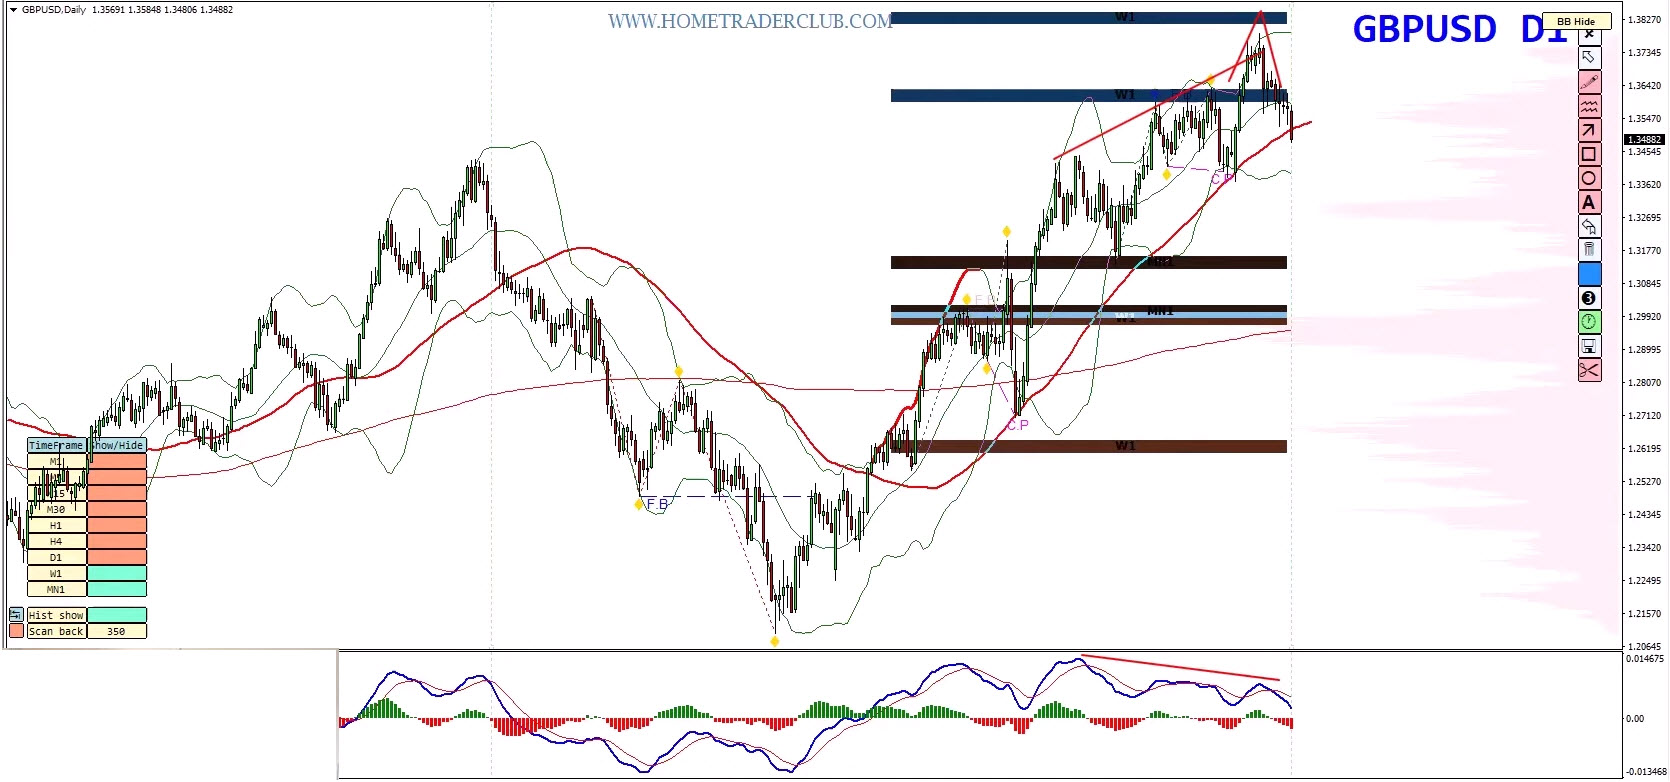
? Daily Chart Highlights:
Bearish MACD Divergence
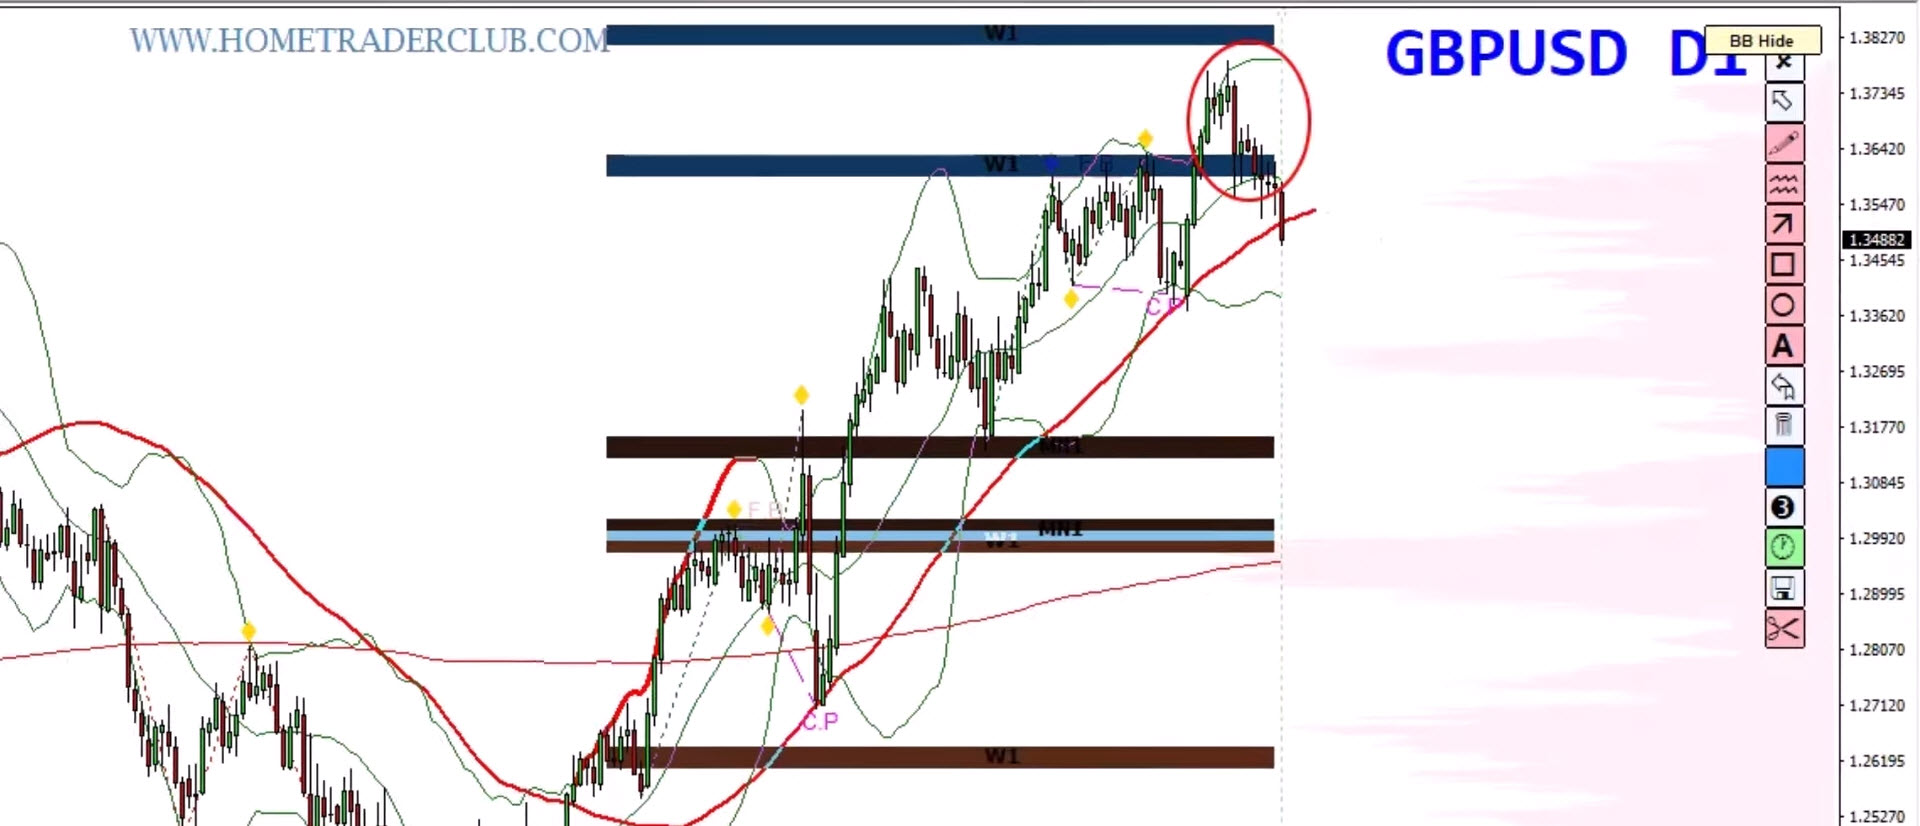
Recent false breakout
Followed by massive engulfing candle
Suggests short-term momentum is flipping bearish
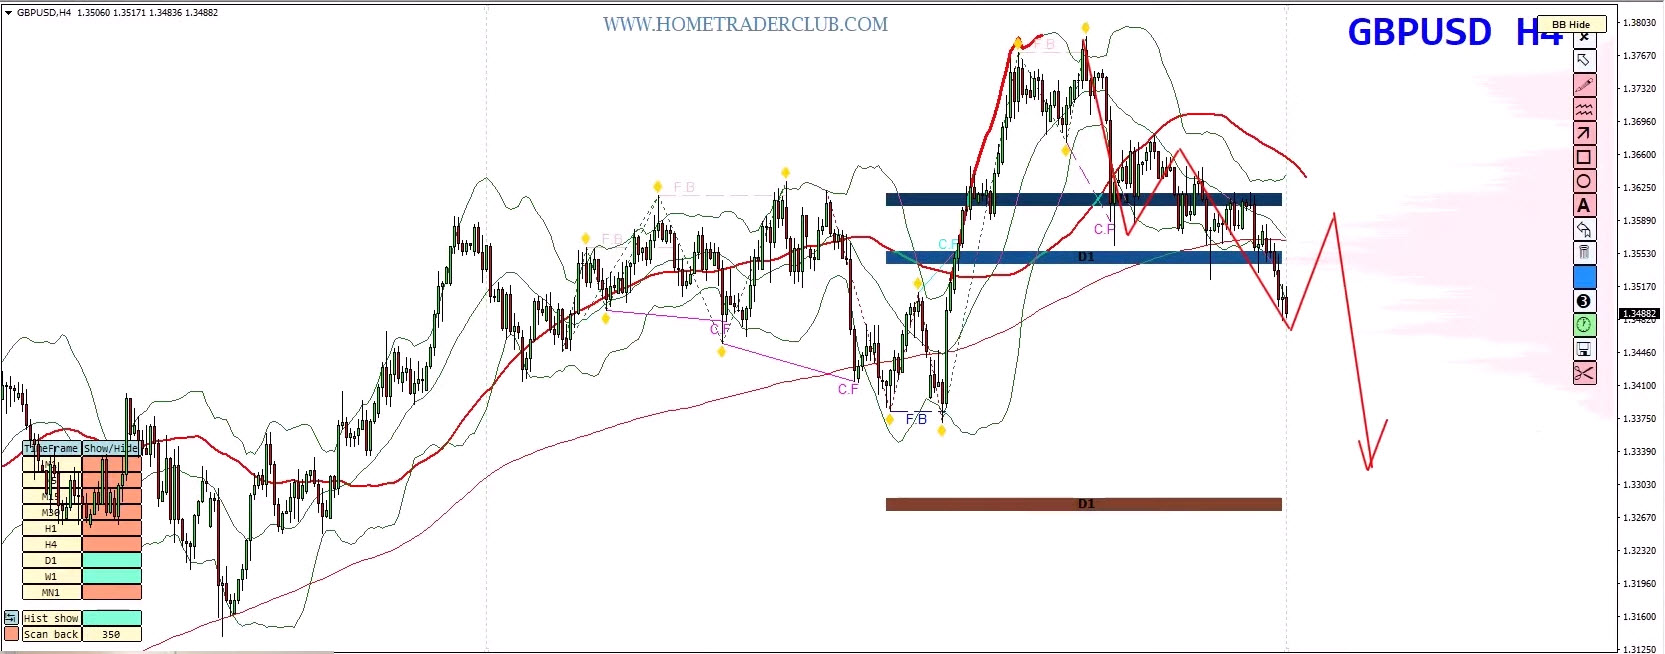
? Targets:
Immediate: 1.3400
Extended: 1.3200–1.3100
? Market Numbers:
Monthly: Now negative
7-Day: Nearly -2%
24H: Over -0.5%
These readings confirm growing bearish momentum.
✅ Strategy: Sell the rallies as long as 1.3750 holds. Corrections expected to deepen before next bullish wave.
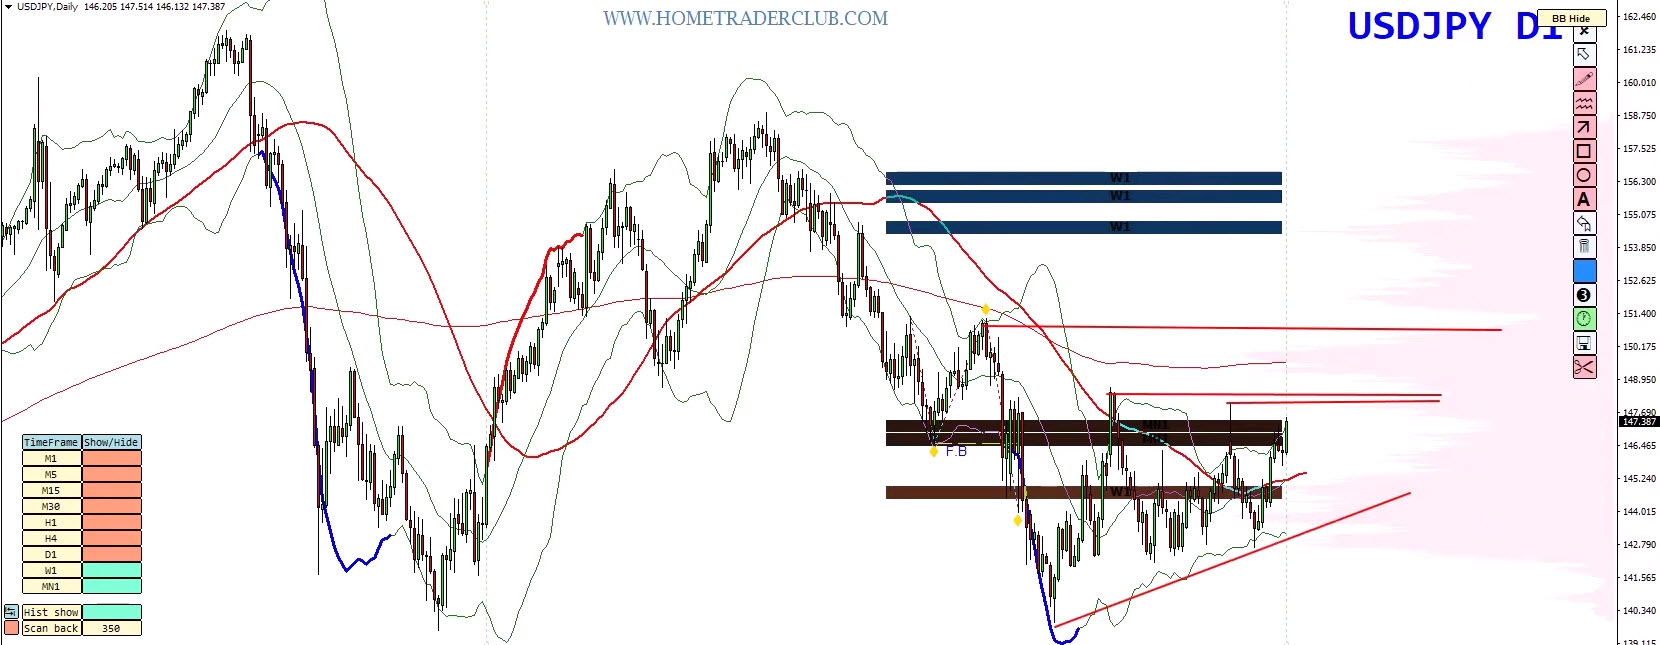
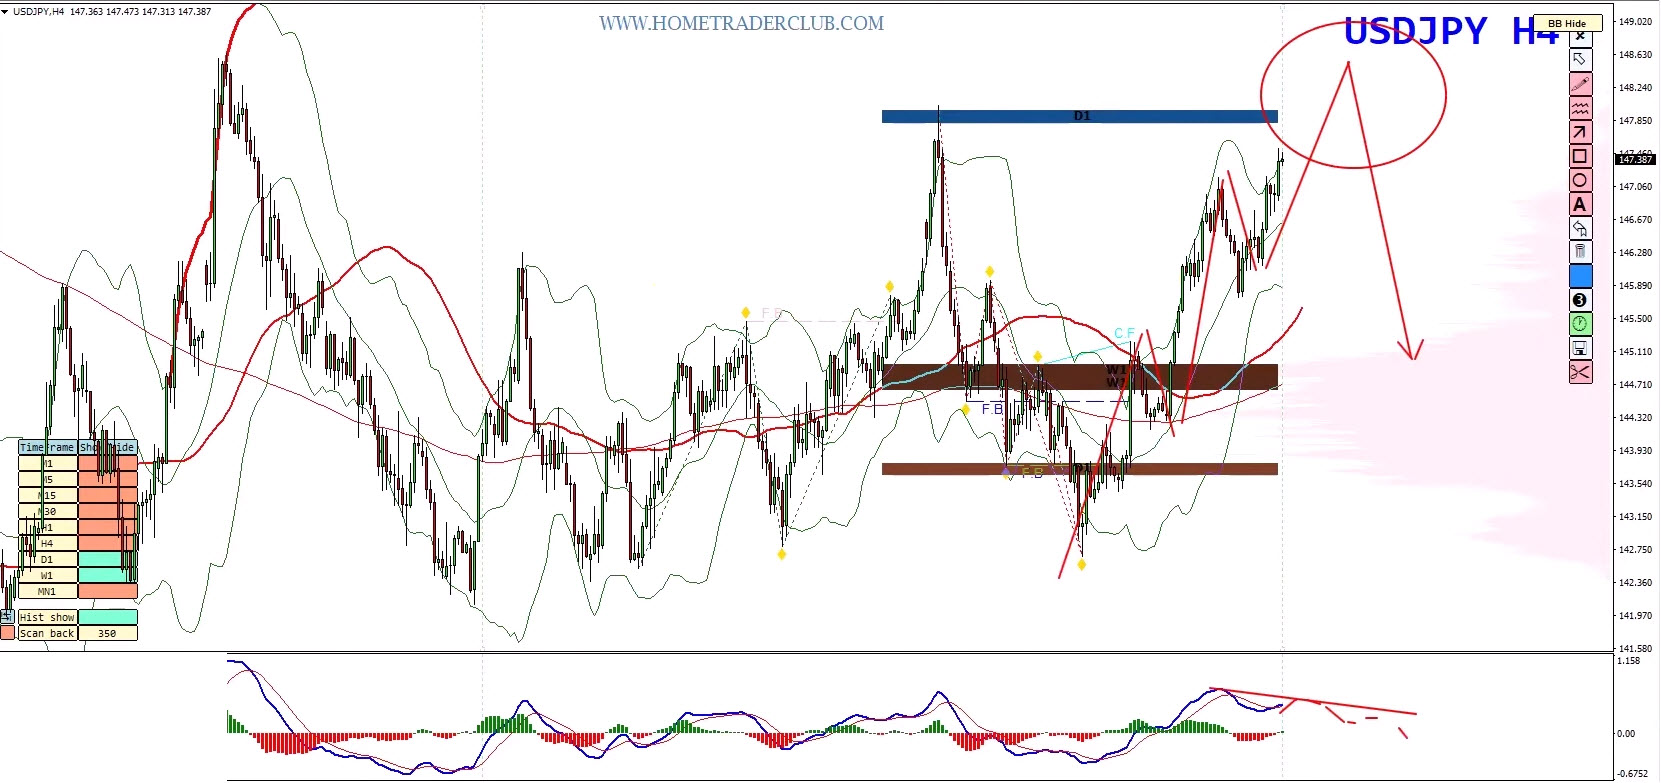
Last week, we discussed the likelihood of a ranging scenario before USD/JPY resumes its bearish trend. That setup is unfolding now.
? Key Resistance Area: 148.00–151.00
Price approaching supply + previous highs
On the 4H chart, a bearish divergence is building
? Trend Snapshot:
Monthly: +1.8%
7-Day: +2.9%
Price is overextended and due for a technical correction
⚠️ While long-term trend remains uncertain, short-term conditions suggest a pullback is near.
✅ Strategy: Wait for 4H reversal signals around resistance to trigger sell setups. Watch divergence + candle formations closely.
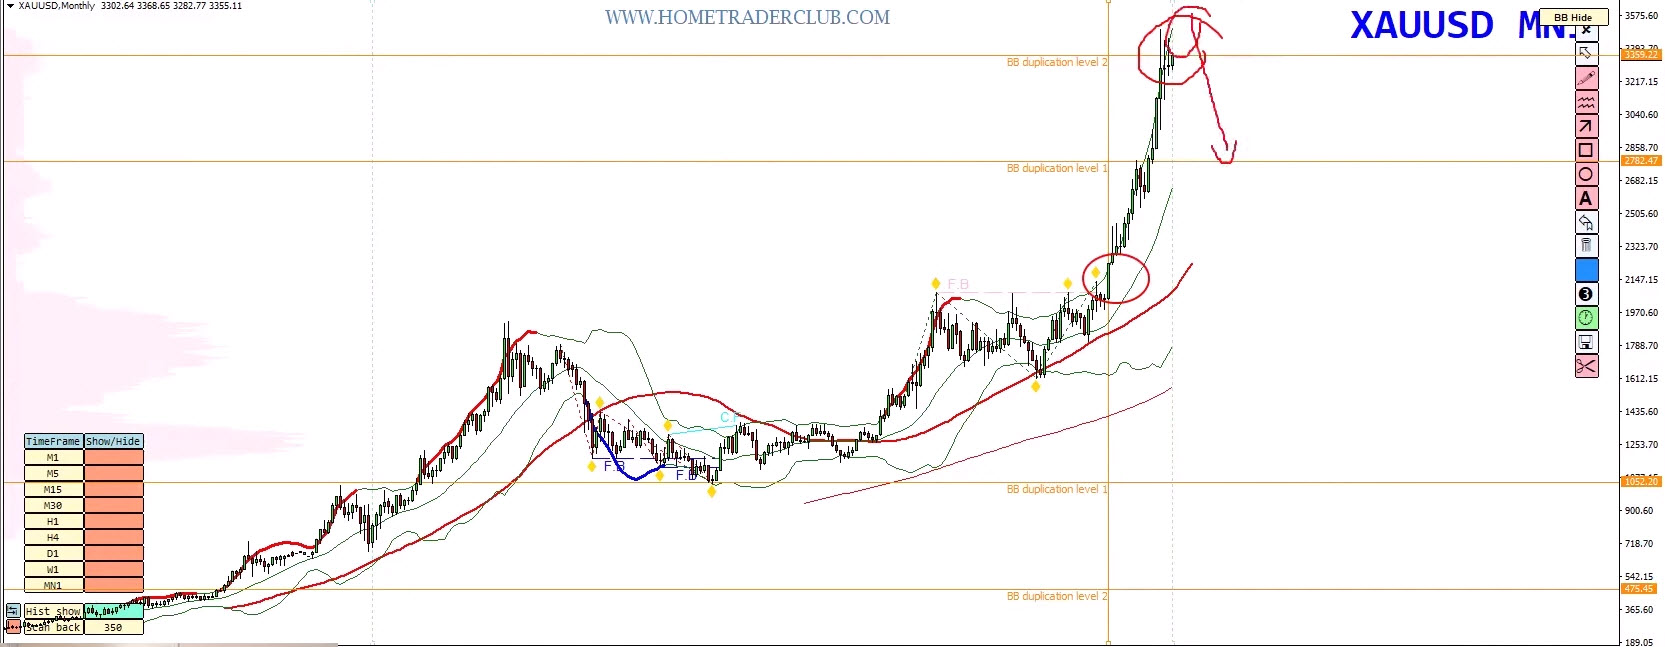
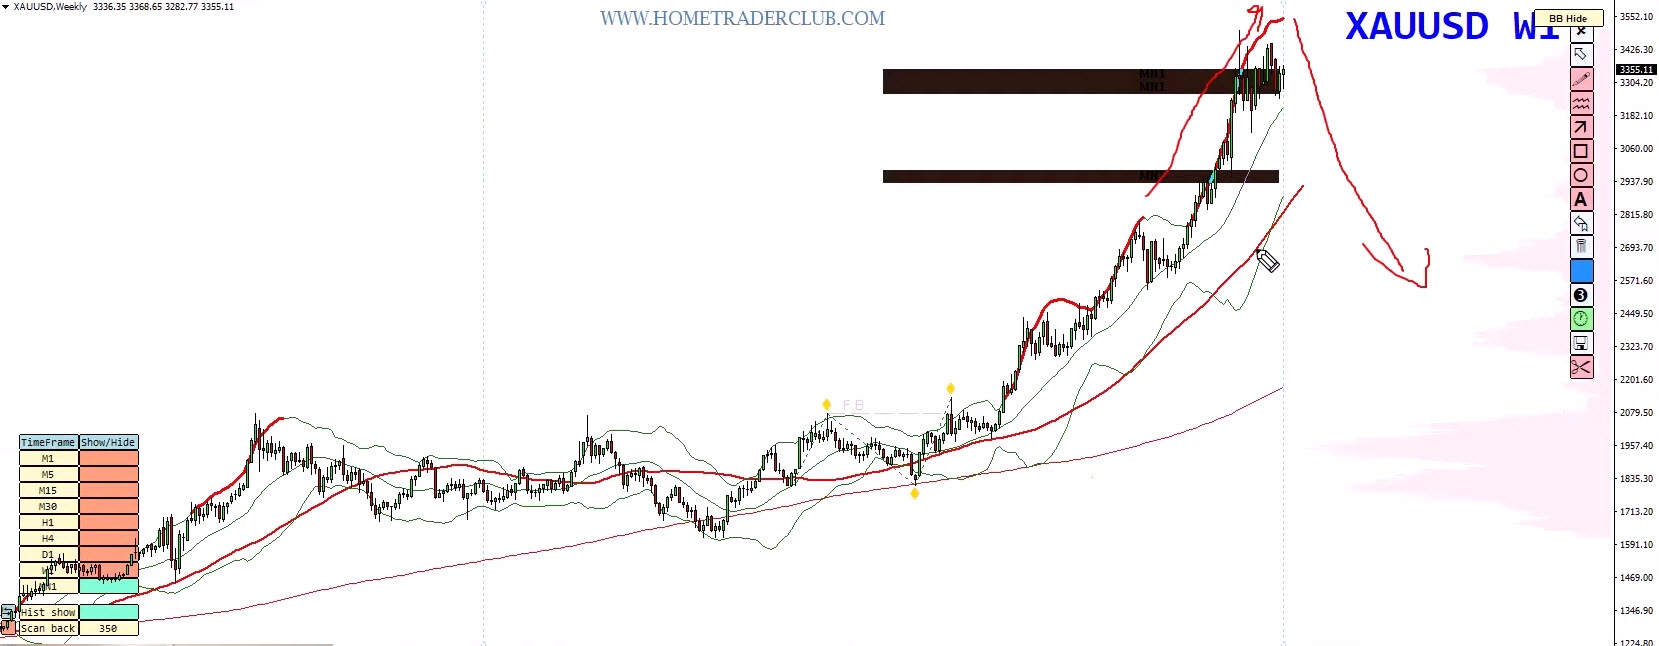
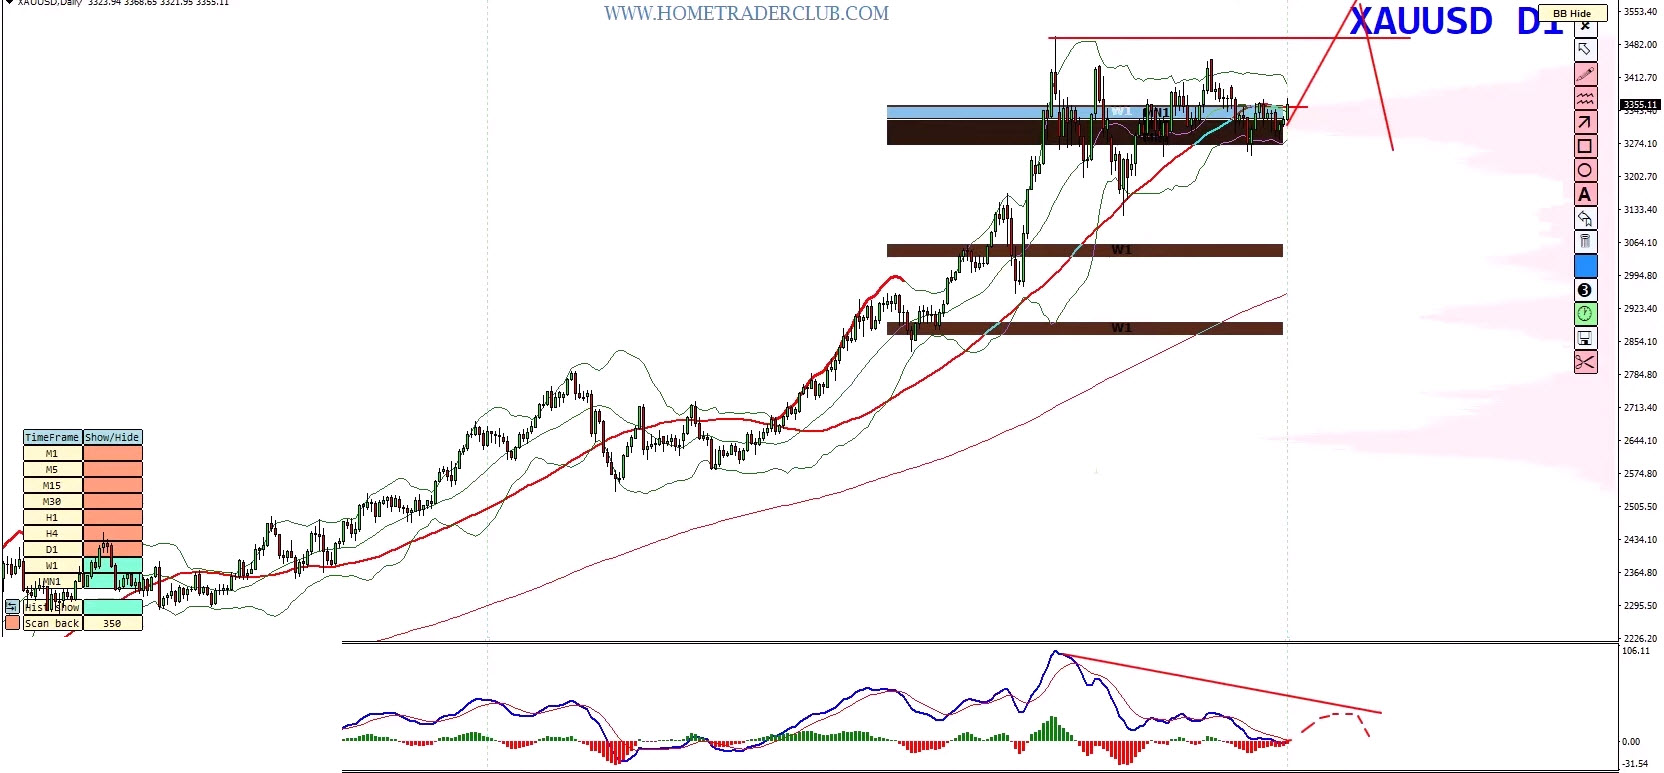
Gold is still in overbought territory, both on the monthly and weekly charts.
? Technical Picture:
Riding upper Bollinger Band for over 20 weeks
Reaching dynamic resistance level 2 on custom indicators
? Key Resistance Zone: 3390–3405
? Final Push Zone: Possibly 3500+ before real selloff begins
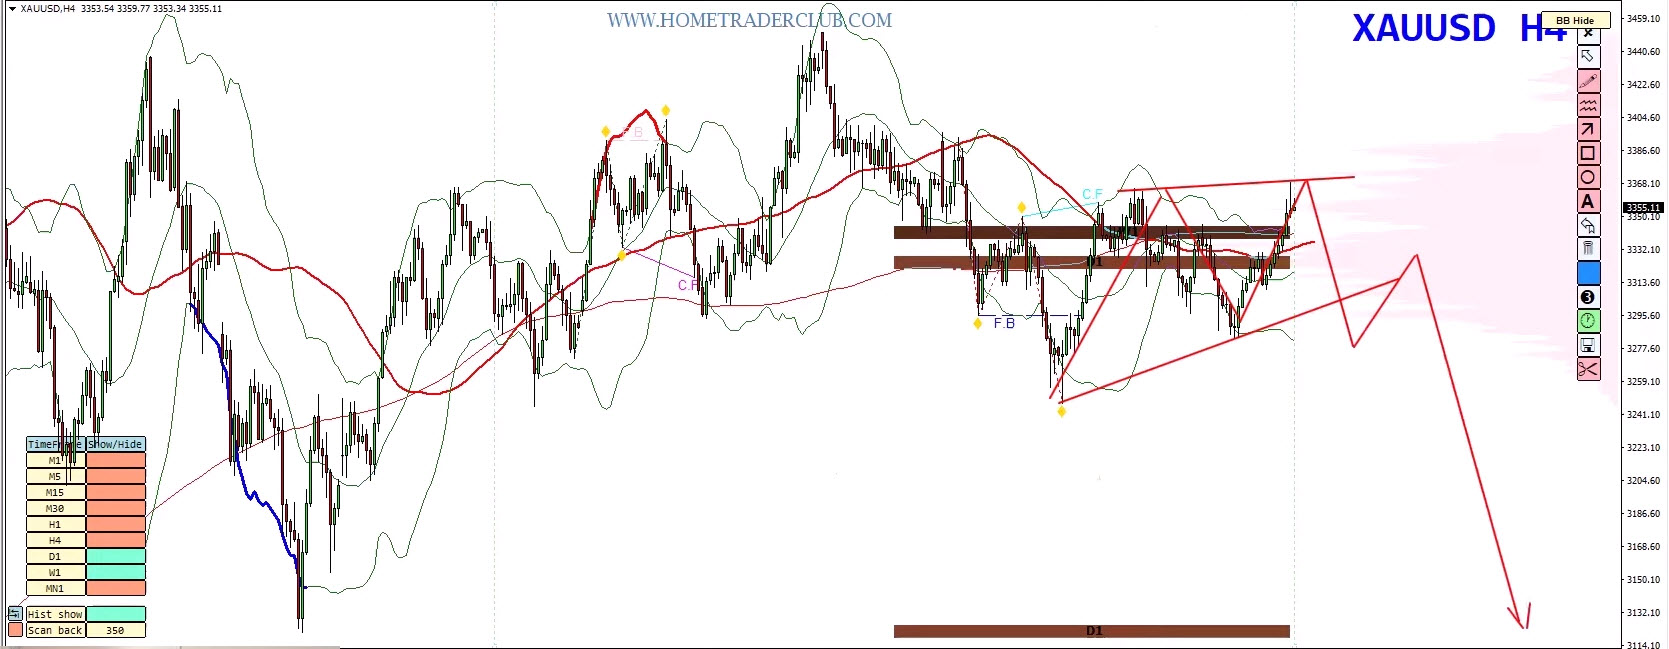
? Two Scenarios to Watch:
Fake breakout above 3500 → then strong bearish divergence → major reversal
Zigzag range develops under current resistance → break lower toward 3100
✅ Strategy: Look for bearish setups under key resistance. Ideal: sell after fake highs or break of range support.
Every forecast above is paired with two scenarios. Why? Because great trading is not about being right — it’s about being ready. Let the market confirm the bias. Use your system, manage risk, and execute only when the structure and confirmation align.
Want to access the tools, systems, and real-time education we use daily?
With Eight Cap Broker’s support, you can now enjoy up to one full year of access to the Home Trader Club — including:
All professional trading systems
Exclusive mentoring sessions
Real-time trade ideas and setups
Full access to our course library and trading marketplace
Wishing you a profitable week ahead!
Vladimir Ribakov
Internationally Certified Financial Technician
Home Trader Club
Hi Traders! Arvinth here from the Home Trader Club team. The weekly summary and, review of March…
Europe’s bonds will struggle to bounce back from a sharp selloff triggered by the war…
Hi Traders! GBPUSD short term forecast and technical analysis is here. We do our analysis…
Hi Traders! SP500 short term forecast update and follow up is here. On December 18th,…
Hi Traders! AUDNZD short term forecast and technical analysis is here. We do our analysis…
Hi Traders! USDJPY short term forecast update and follow up is here. On January 29th,…