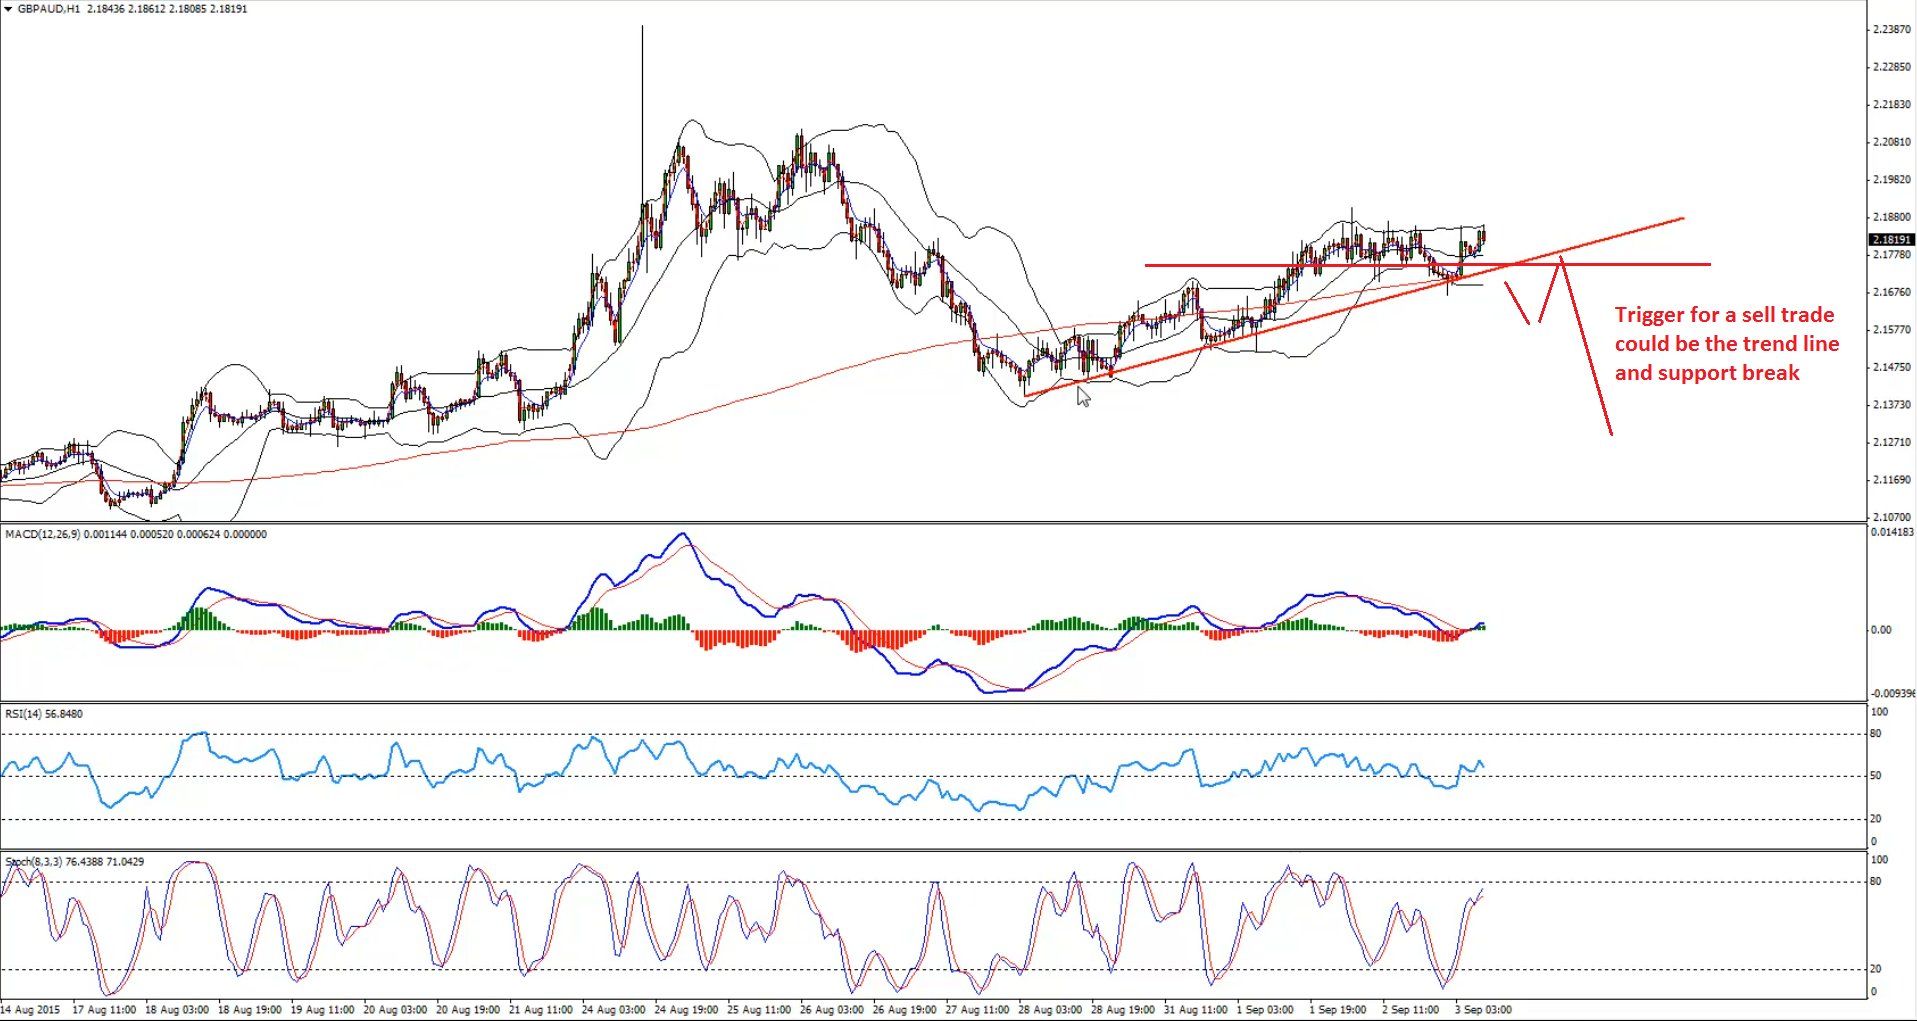
The British pound continued to slowly grind higher against the Aussie Dollar, as the GBPAUD pair is trading above the 100 hourly moving average. There is a support trend line formed on the hourly chart, which is protecting losses in the pair. However, I think it would be best to wait for a break below the highlighted trend line and support area for a sell entry.
We might witness a possible move towards the 2.14-13 if there is a convincing break lower.
Technical Analysis
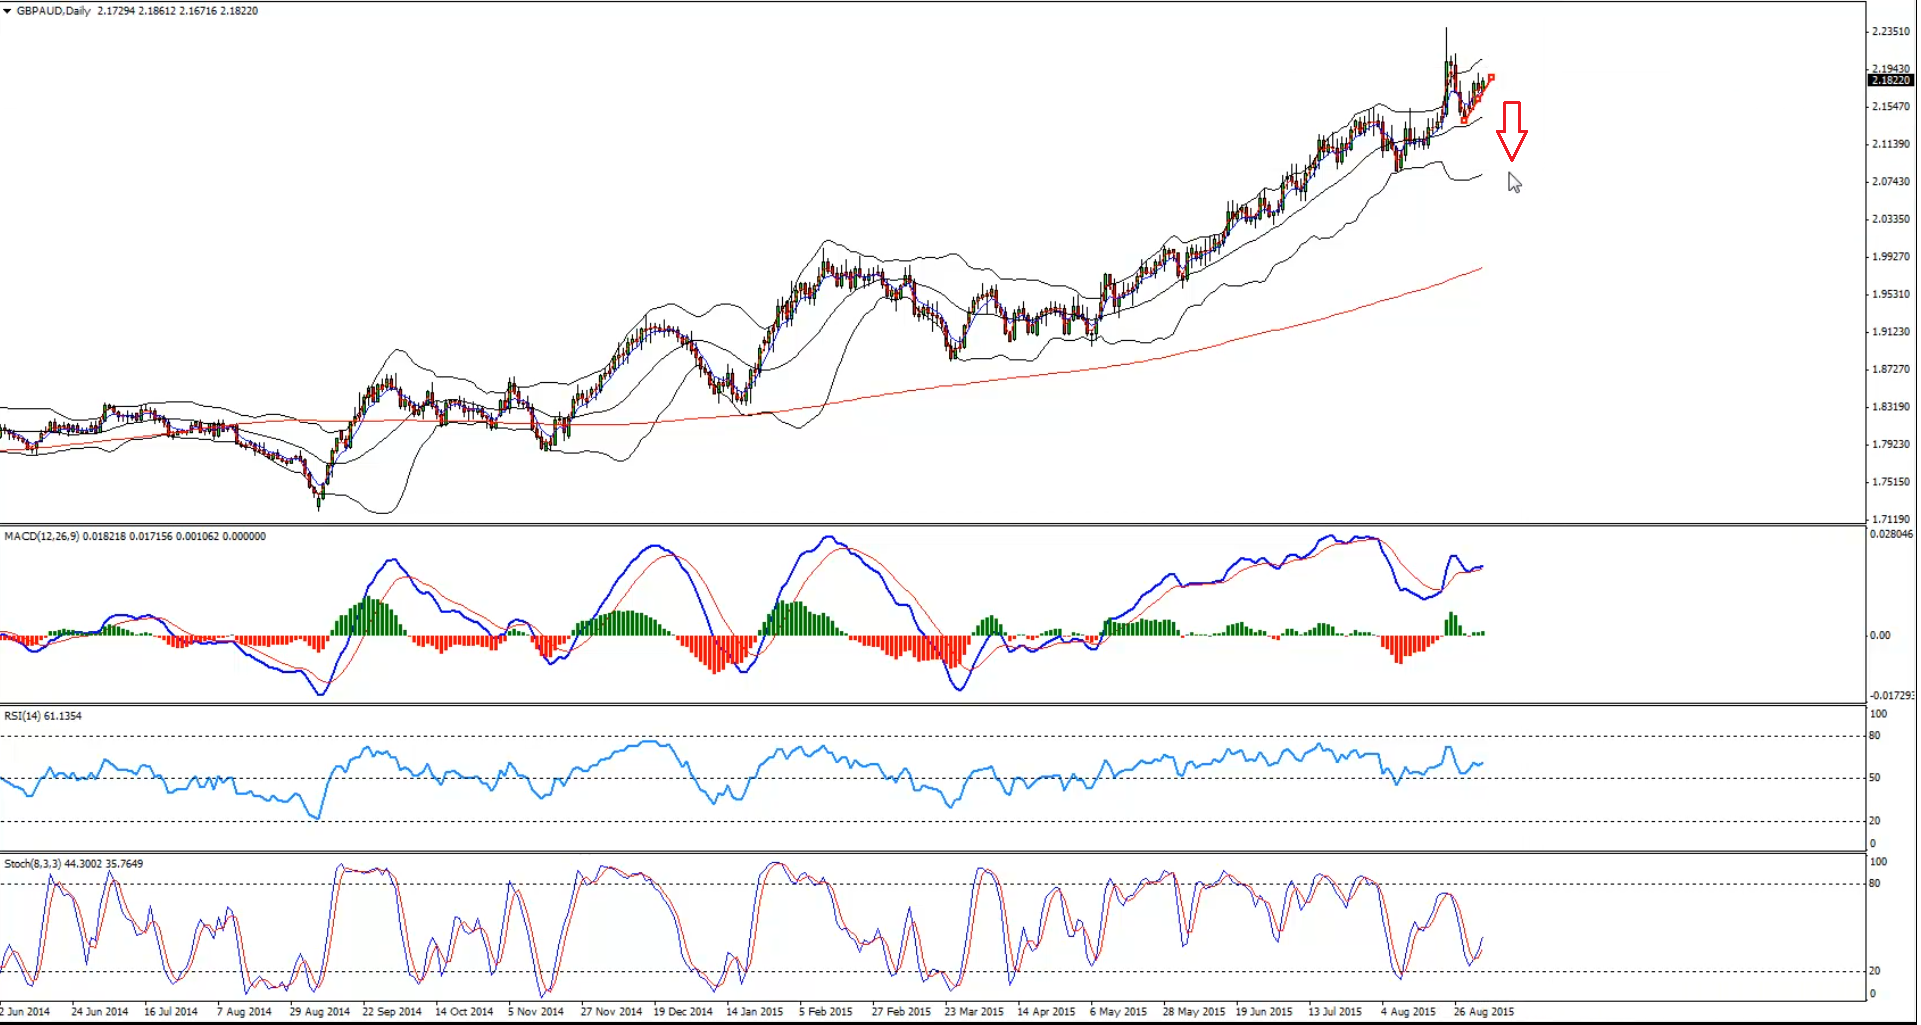
D1– Chart highlighting the possibility a down move in GBPAUD.
Entry:
H1– We can enter a sell trade in the GBPAUD pair if it breaks the highlighted trend line and support area, and settles below it.
Target 1: 2.1550
Target 2: 2.1400
Stop Loss: Above the broken trend line and support area (turned resistance) combination.
Video Explanation
Yours,
Vladimir
Hi Traders! Arvinth here from the Home Trader Club team. The weekly summary and, review of March…
Europe’s bonds will struggle to bounce back from a sharp selloff triggered by the war…
Hi Traders! GBPUSD short term forecast and technical analysis is here. We do our analysis…
Hi Traders! SP500 short term forecast update and follow up is here. On December 18th,…
Hi Traders! AUDNZD short term forecast and technical analysis is here. We do our analysis…
Hi Traders! USDJPY short term forecast update and follow up is here. On January 29th,…