Hi friends,
As I explained on the weekly review, the pair might create a bottom around 1.51 and retrace to the upside. As it seems right now, the pair is following our plan.
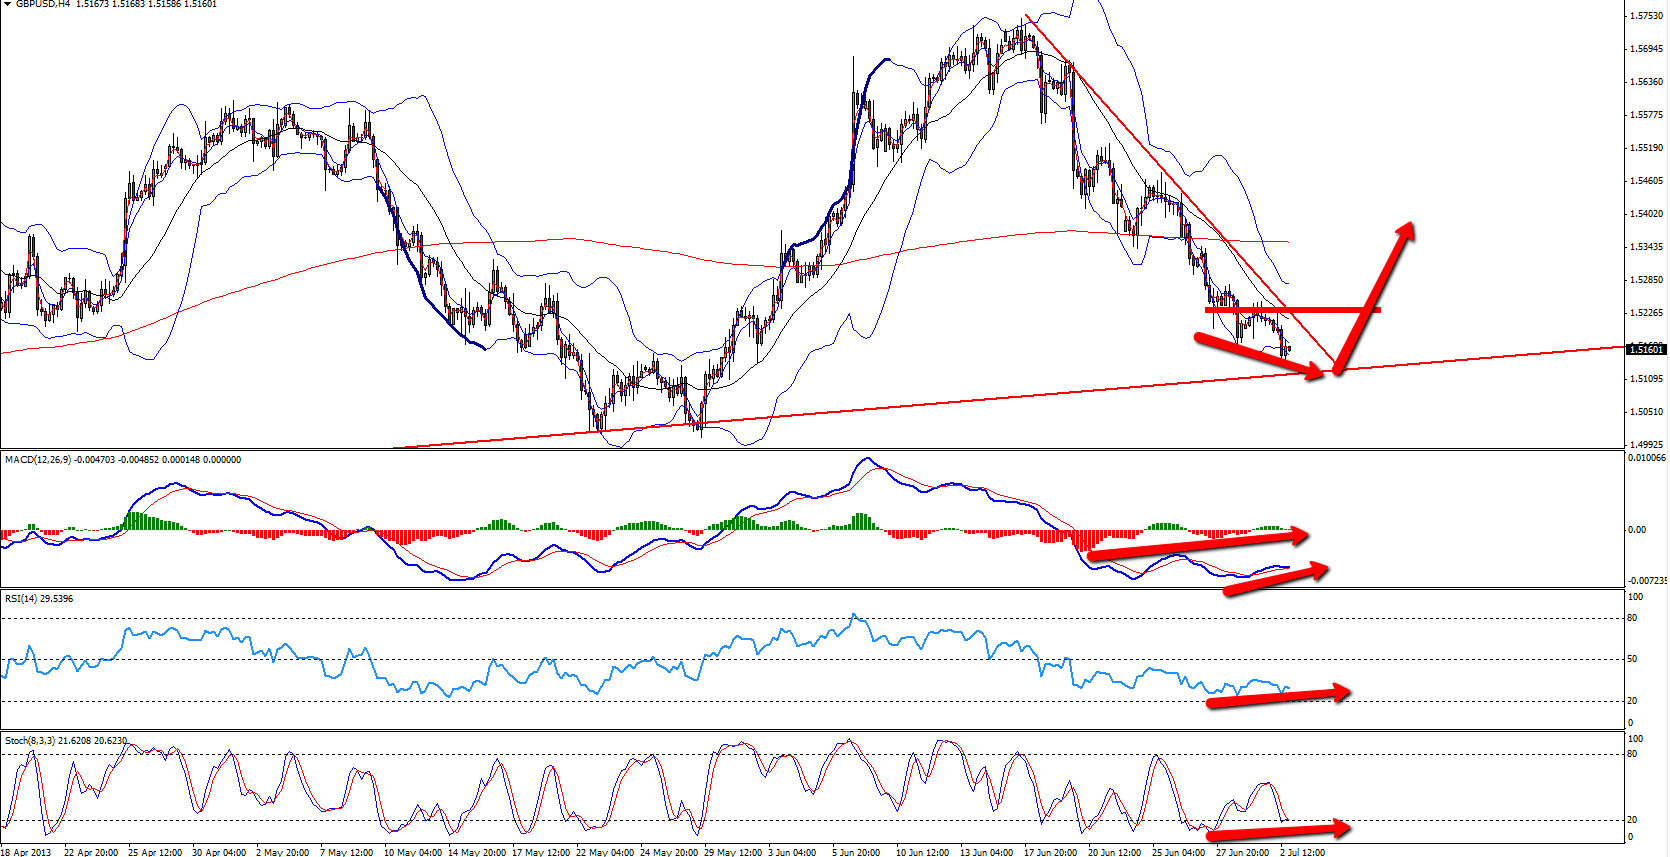
As you can see on the chart below, the GBPUSD is creating nice 4H divergence while it is holding the daily trend line. One thing I still want it to do – to break the bearish trend line it has on the 4H chart.
If it does, while breaking the resistance at 1.5240 as well, it might be a wonderful bullish call for the pair to move above 1.54 again. A break below 1.51 will be a warning sign that maybe, after all, the bulls are not here yet.
Click on the chart to enlarge it:
Now let’s see if the market will accept with us 🙂
Please note that Thursday is a holiday day in USA, the volatility will be very low! And Friday is NFP day, so keep trading risks low.
Yours,
Vladimir Ribakov
Hi Traders! USDJPY short term forecast update and follow up is here. On January 29th,…
Hi Traders! AUDCHF short term forecast and technical analysis is here. We do our analysis…
World markets rapidly reversed course on Monday after U.S. President Donald Trump said he will…
Hi Traders! Arvinth here from the Home Trader Club team. The weekly summary and, review of March…
Gold sank for a seventh session as the escalating war in the Middle East drove oil…
Hi Traders! EURGBP short term forecast and technical analysis is here. We do our analysis…
View Comments
Good luck my friend and remember, results are measured on long period
Hi Pinto
The higher the TF the stronger the divergence, that's very correct. On lower TF you have to play much more careful. I agree with your words
Thank you Darryl