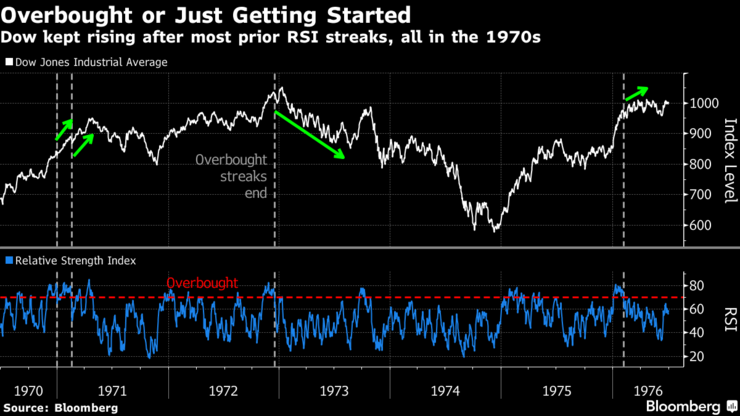
History Hints Overbought Dow May Be Just Getting Started: Chart
Who you gonna trust, the technical analysts or the historians? The last time the Dow Jones Industrial Average rallied with as much sustained momentum as now was in the 1970s, when its relative strength index had four streaks in overbought territory of 22 trading days or more. Techies consider a cross below the RSI threshold of 70 a bearish signal. Seller beware: The Dow continued rising after three of those previous four.
Source – Bloomberg
Welcome to this week’s Forex forecast. In this analysis, we break down the key technical…
Hi Traders! Arvinth here from the Home Trader Club team. The weekly summary and, review of April…
Stocks and bonds fell as oil surged anew, with President Donald Trump dashing optimism that the war in…
Hi Traders! GBPCAD short term forecast and technical analysis is here. We do our analysis…
Hi Traders! AUDJPY short term forecast and technical analysis is here. We do our analysis…
Hi Traders! EURJPY short term forecast update and follow up is here. On February 3rd,…
View Comments
Wow, that's really interesting to know.
I always trust the historians :)
Thanks for sharing this useful information