In the ever-evolving landscape of financial markets, traders continually seek tools that can provide them with a competitive edge. One such tool that has stood the test of time is the Relative Strength Index (RSI). Developed by J. Welles Wilder, the RSI is a versatile indicator that can offer valuable insights into market trends and potential reversals. In this article, we will explore three proven ways to effectively use the RSI indicator, as well as three common pitfalls that traders should be wary of.
This article is available to you, thanks to the support of our recommended broker Eight Cap
As an Internationally Certified Financial Technician (CFTe, IFTA) and former private capital hedge fund trader, I have successfully mentored numerous students who are now thriving in the trading world. Students who learned with me, are now full-time traders, work in the trading industry, run their own capital firms or are fully funded traders by private companies, develop automated trading solutions and manage others’ capitals. I am a very proud mentor and I am proud of the success stories I’ve helped create, and for a limited time, I’m offering my mentorship program for free through a partnership with Eight Cap broker. Join Eight Cap, become an active trader, and choose the offer that suits you best –
For more details, visit: Home Trader Club Mentorship Program
I’m excited to work with you and help you reach your desired level of success!
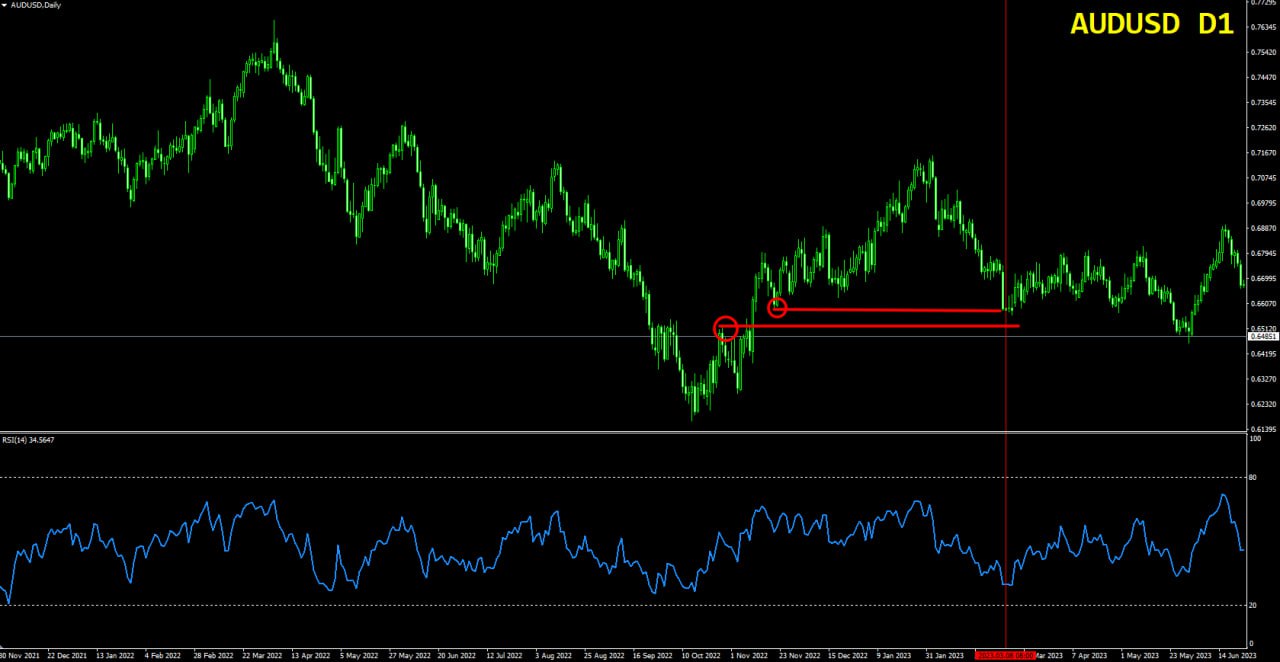
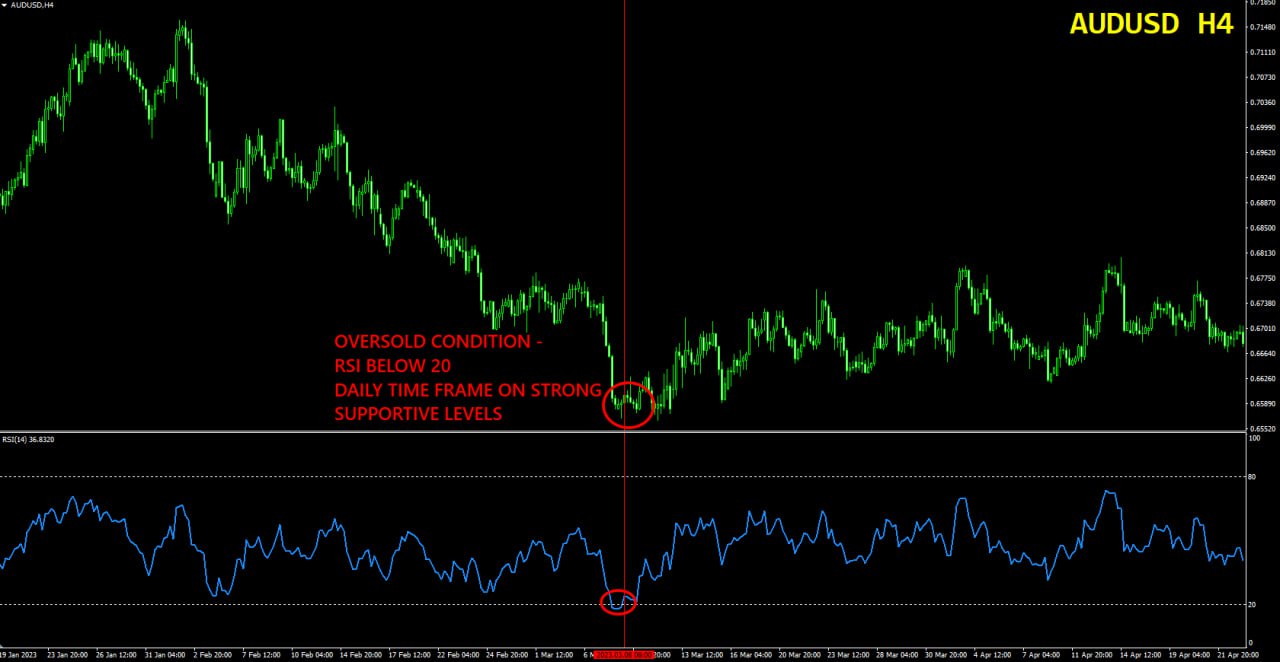
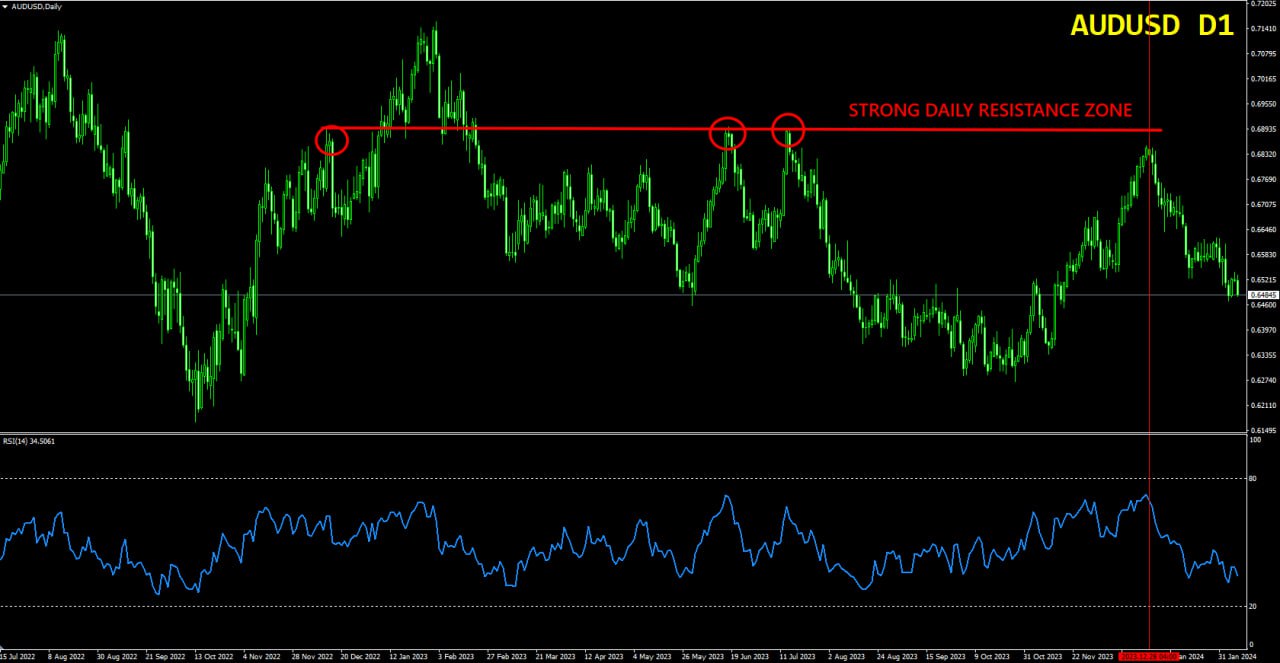
One of the classic applications of the RSI is identifying overbought and oversold conditions in the market. When the RSI surpasses the extreme level (by default) 70 threshold, it indicates that an asset may be overbought, suggesting a potential reversal or correction. Conversely, an extreme level RSI below 30 suggests oversold conditions, hinting at a possible upward reversal. Traders can use these signals to time their entries and exits strategically.
Personally, I love to go even more extreme and use the levels of 80 for overbought conditions, and 20 for oversold conditions.
Important tips – Combine the extreme levels of the RSI indicator with key trading levels, such as support or resistance, demand or supply or trend lines, and ideally from higher time frame, for extra reliability of the signal!
Examples
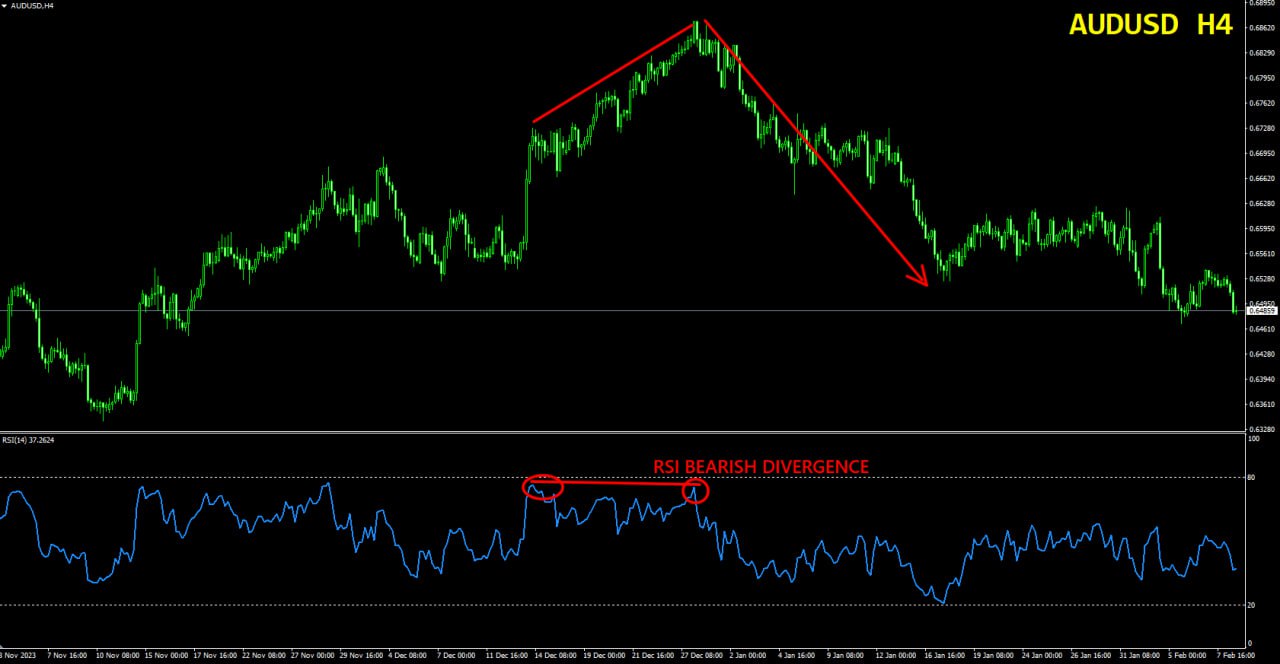
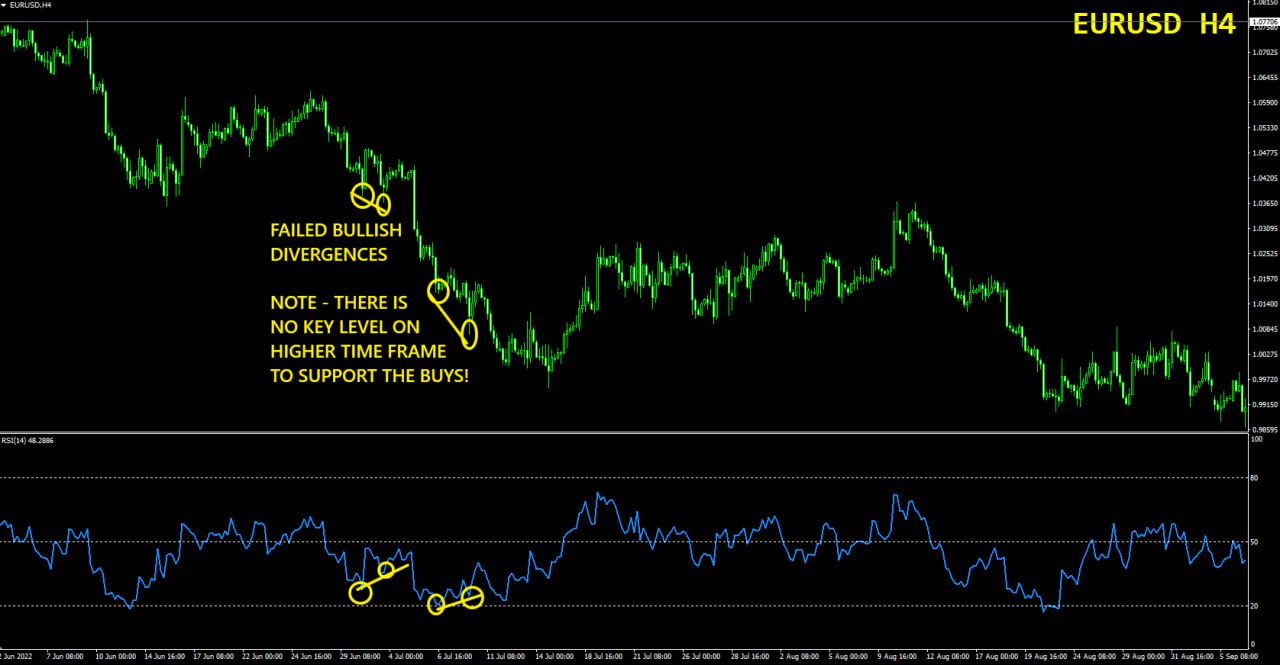
Divergence occurs when the price movement of an asset disagrees with the RSI reading. Bullish divergence happens when the price makes a new low, but the RSI fails to confirm it with a new low, indicating weakening bearish momentum. On the other hand, bearish divergence occurs when the price makes a new high, but the RSI fails to confirm it, signaling potential weakness in the bullish trend. Recognizing divergence can provide traders with early indications of trend reversals.
Important tip – Combine the divergences on key trading levels, such as support or resistance, demand or supply or trend lines, and ideally from higher time frame, for extra reliability of the signal
Examples
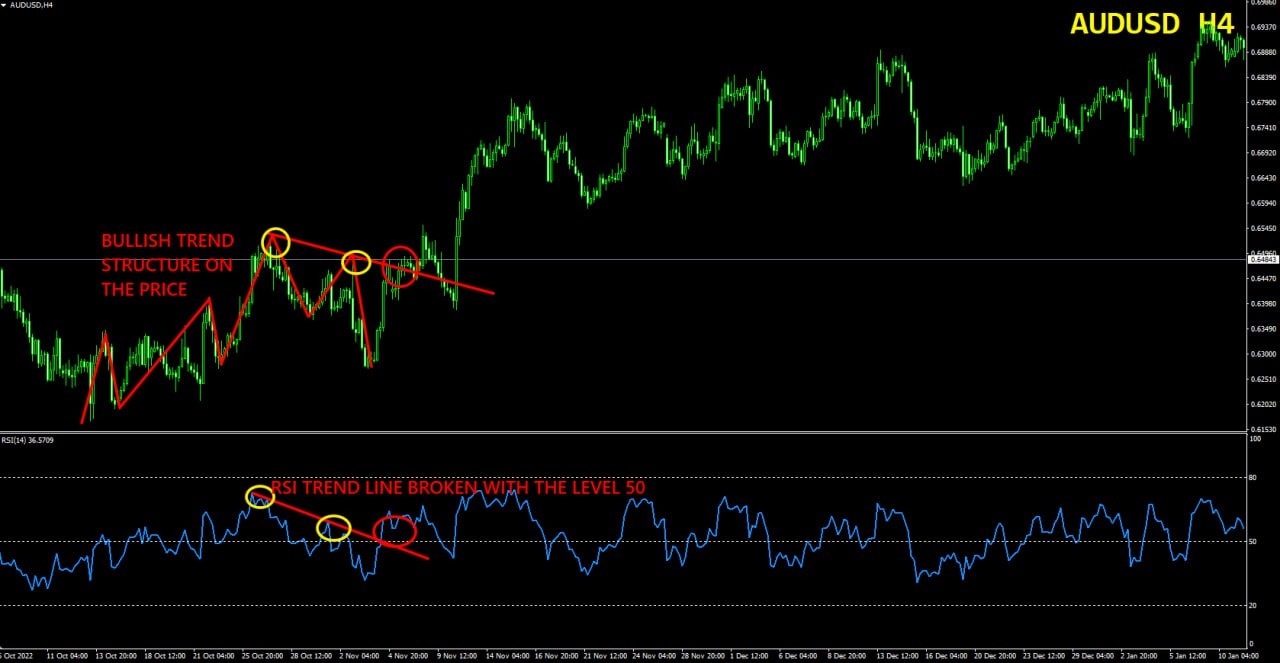
Drawing trendlines on the RSI chart can be a powerful technique for trend analysis. When the RSI breaks above a downtrend line or below an uptrend line, it can signal a potential shift in market sentiment. This method complements traditional trendline analysis on price charts and enhances the trader’s ability to confirm trends and reversals accurately.
Important tip – when the RSI indicator breaks the trend line, verify it with the breakout of the level 50 on RSI. Above 50 for buy, below 50 for sell.
And most importantly – make sure that the price structure on the chart is sync. With the direction you look to trade. For example, if you look to buy a breakout above trend line and RSI 50 level, make sure you are in uptrend and the price structure is bullish (sequence of higher highs and lows).
Example
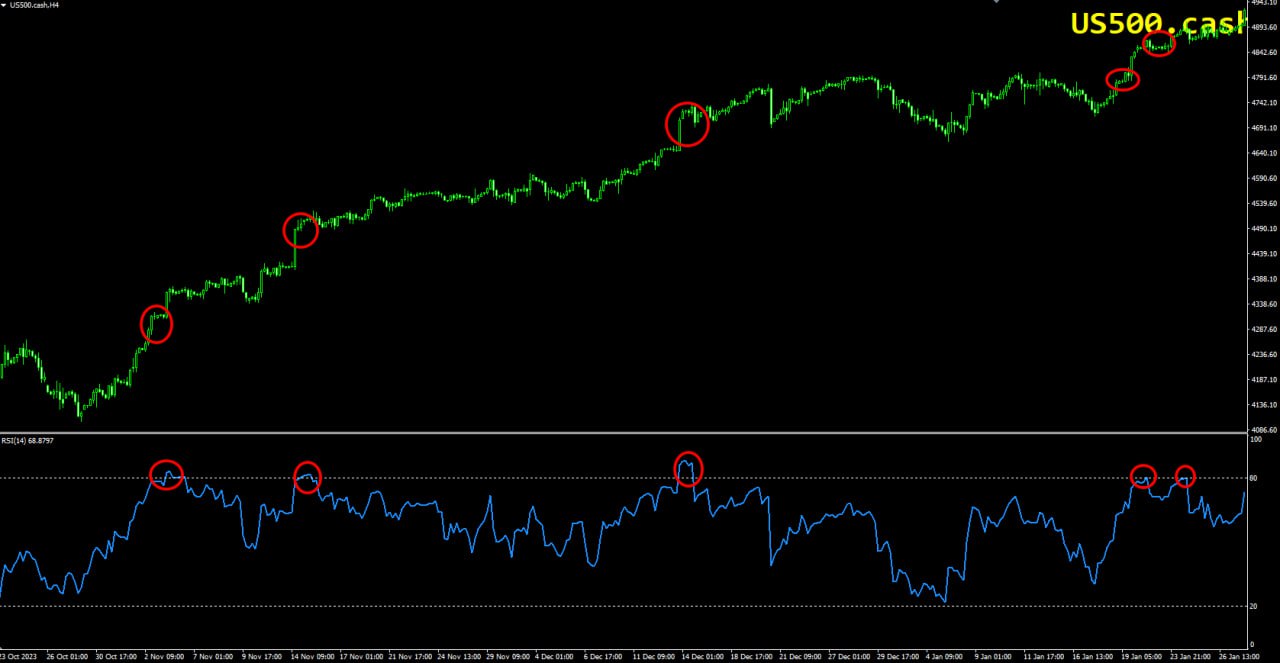
While overbought and oversold conditions are valuable signals, relying solely on extreme RSI readings can lead to missed opportunities. Markets can remain overbought or oversold for extended periods during strong trends, and blindly following these signals without considering other factors can result in poor trading decisions.
Example
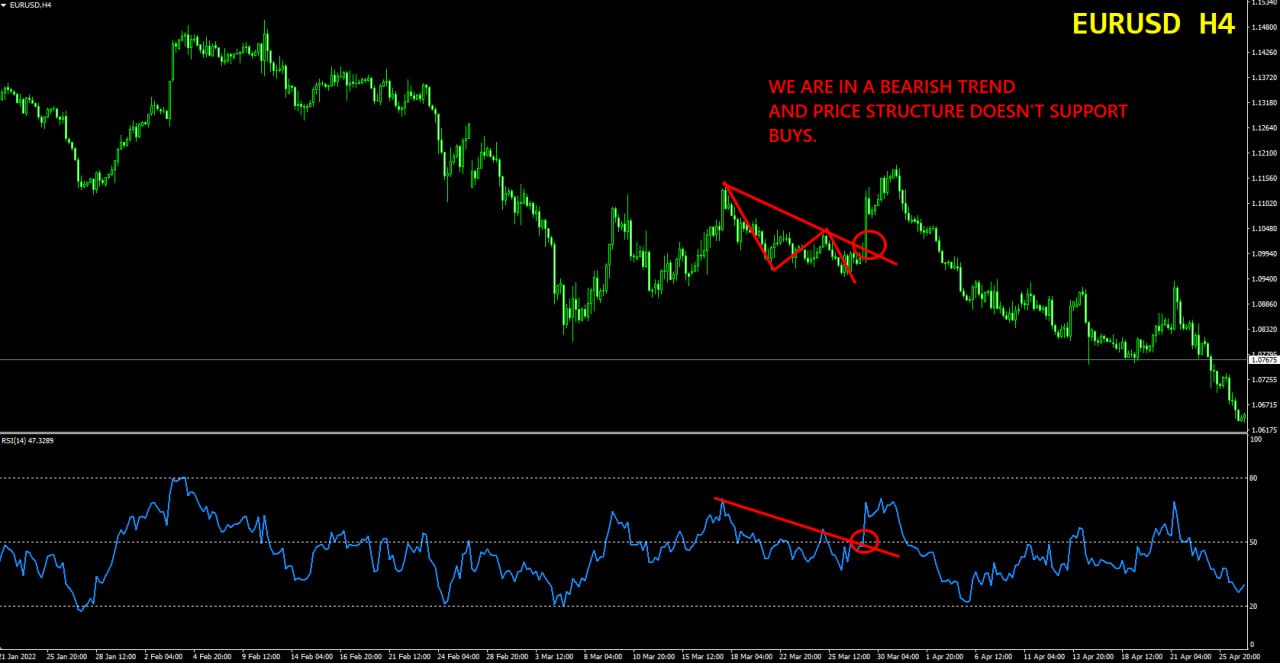
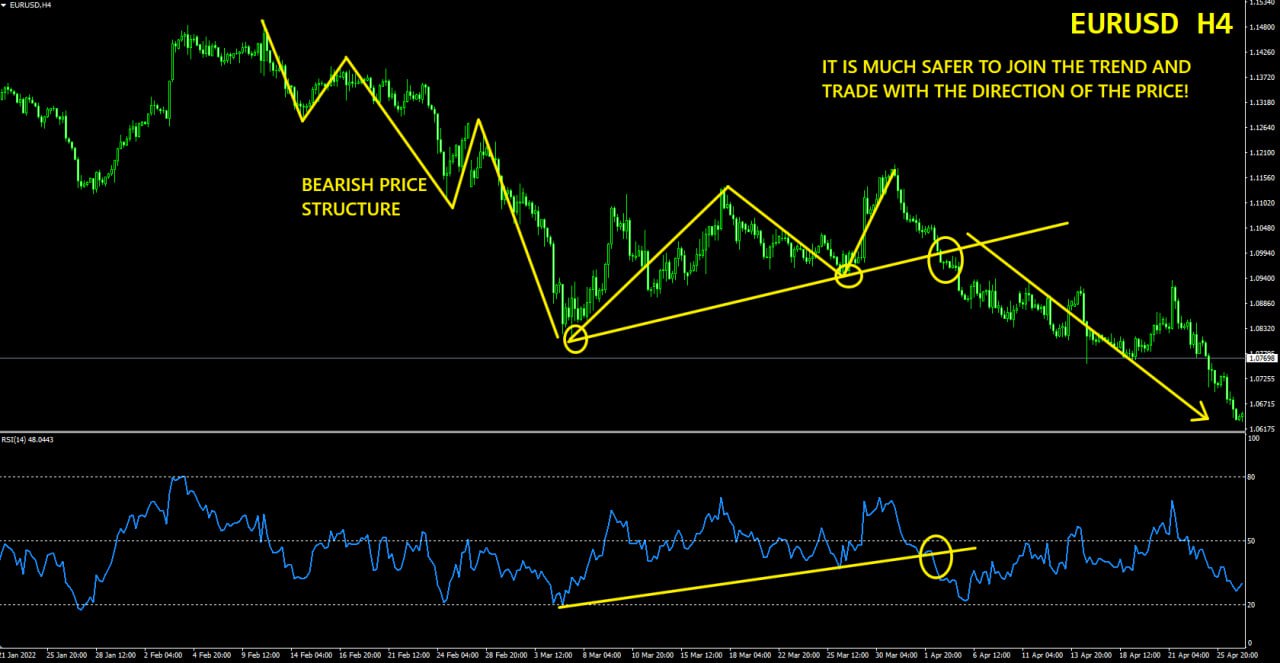
The RSI is a momentum oscillator, but it should not be used in isolation. Traders must consider price action, trending price structures, support and resistance levels, and other technical indicators to validate RSI signals. Ignoring broader market context can lead to false signals and misguided trading strategies.
Examples
While divergence analysis can be powerful, it is crucial to interpret it accurately. Traders should not rely solely on divergence signals without confirming them with other technical indicators or price action. Misinterpreting divergence can lead to premature entries or exits, resulting in potential losses.
Example
Effectively using the RSI indicator requires a nuanced understanding of its strengths and limitations. By incorporating proven strategies such as identifying overbought/oversold conditions, divergence analysis, and RSI trendline breaks, traders can enhance their decision-making process. However, it is equally important to be aware of common pitfalls, such as overreliance on extreme readings, ignoring price action, and misinterpreting divergence. Striking a balance and integrating the RSI into a comprehensive trading strategy can empower traders to navigate the markets with confidence and precision.
To your success,
Vladimir Ribakov
Home Trader Club
Hi Traders! Arvinth here from the Home Trader Club team. The weekly summary and, review of July…
U.S. stock indexes hit multi-week lows on Thursday, as concerns over heavy AI spending resurfaced…
Hi Traders! GBPUSD short term forecast and technical analysis is here. We do our analysis…
Hi Traders! Ethereum short term forecast follow-up and update is here. On May 26th, 2026…
Hi Traders! GBPAUD short term forecast and technical analysis is here. We do our analysis…
Hi Traders! USDCHF short term forecast update and follow up is here. On May 20th,…