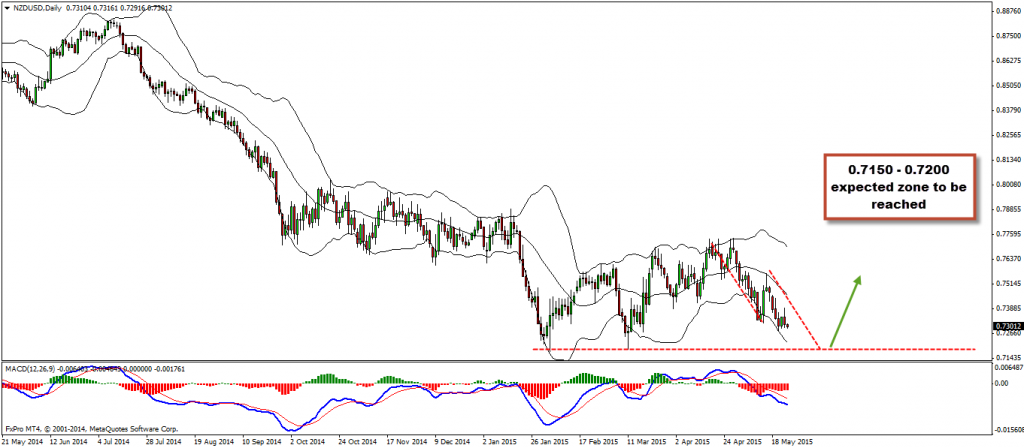
Pair is still in pretty obvious bearish trend and i think it is best to sell rallies as long as the last swing high around 0.7400 holds. Technically the pair has all reasons to push lower to the 0.7200 – 0.7150 zone. That would mean bearish wave duplication which also coincides with a strong supportive zone and bollinger band duplication. Ideally we want to see the levels mentioned above before looking for buy opportunities.
Technical Analysis:
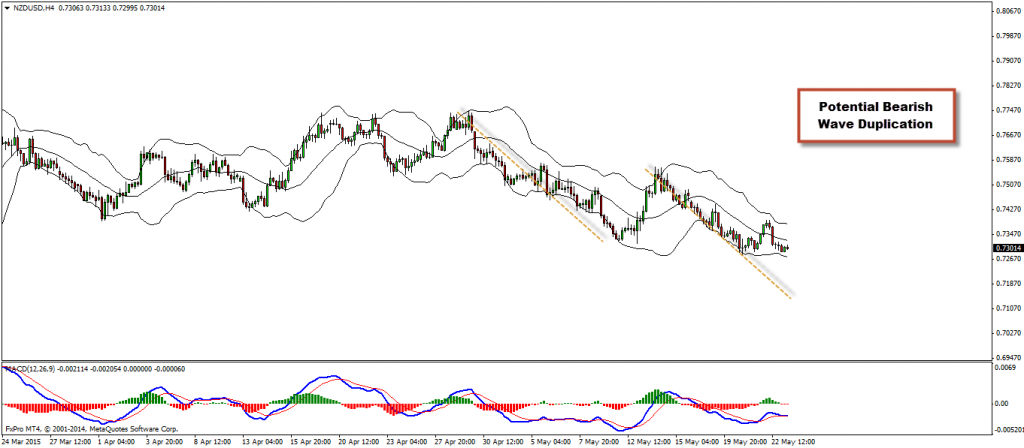
D1/H4 – potential bearish wave duplication
Entry:
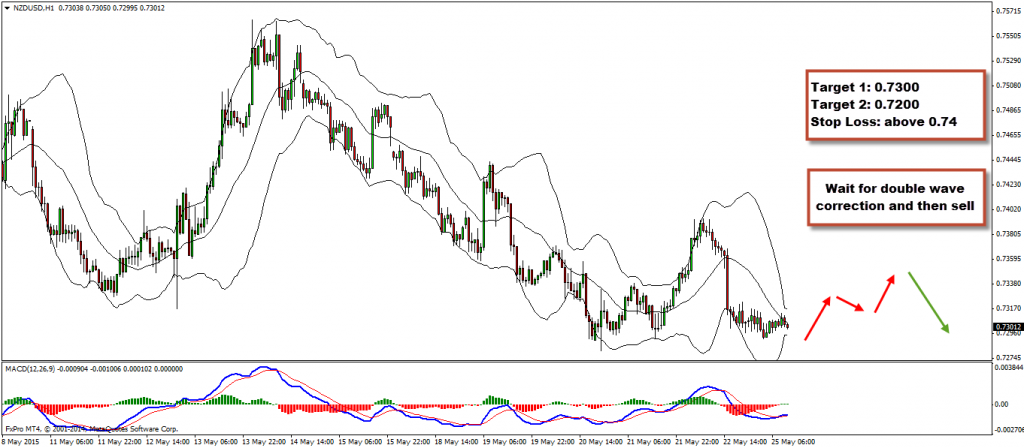
H1 – Wait for double wave corrections and look for a sell. Preferably with hidden bearish divergence to form. Keep in mind that last swing high around 0.7400 must hold for this scenario to be valid.
Target 1: 0.7300
Target 2: 0.7200
Stop Loss: above 0.74
Video Explanation:
Yours,
Vladimir
Hi Traders! USDJPY short term forecast update and follow up is here. On January 29th,…
Hi Traders! AUDCHF short term forecast and technical analysis is here. We do our analysis…
World markets rapidly reversed course on Monday after U.S. President Donald Trump said he will…
Hi Traders! Arvinth here from the Home Trader Club team. The weekly summary and, review of March…
Gold sank for a seventh session as the escalating war in the Middle East drove oil…
Hi Traders! EURGBP short term forecast and technical analysis is here. We do our analysis…