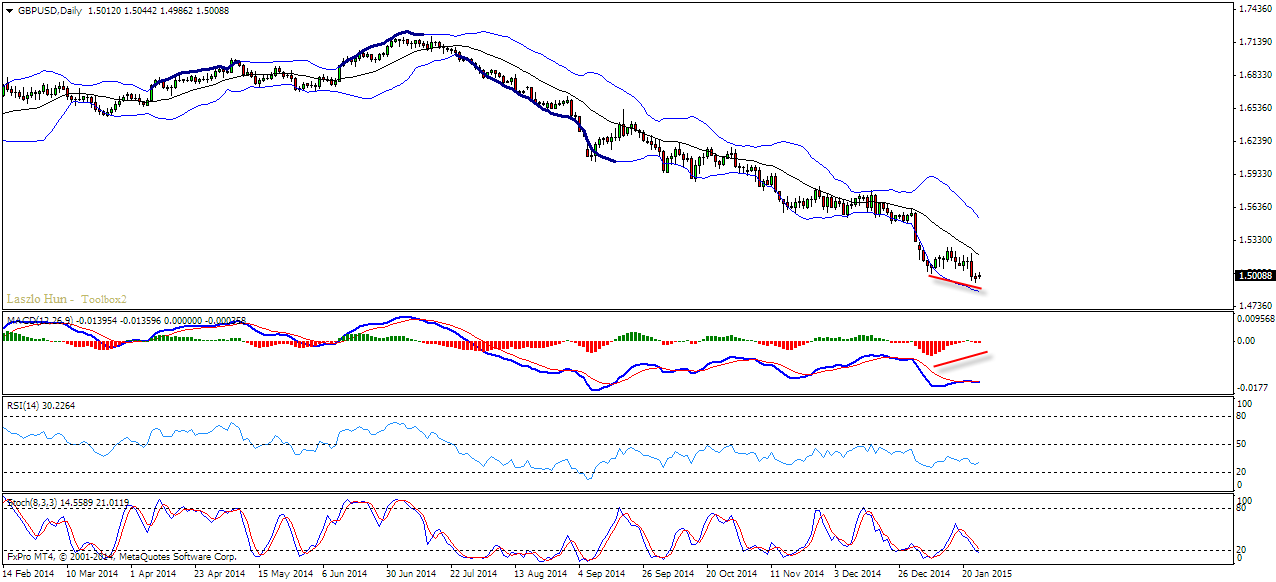
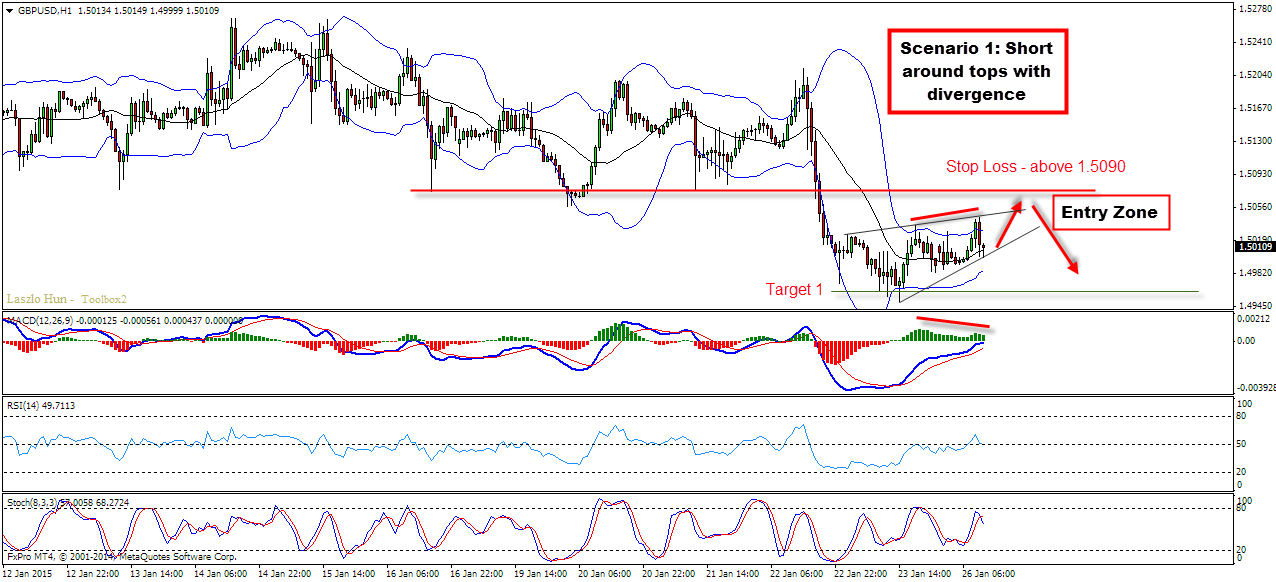
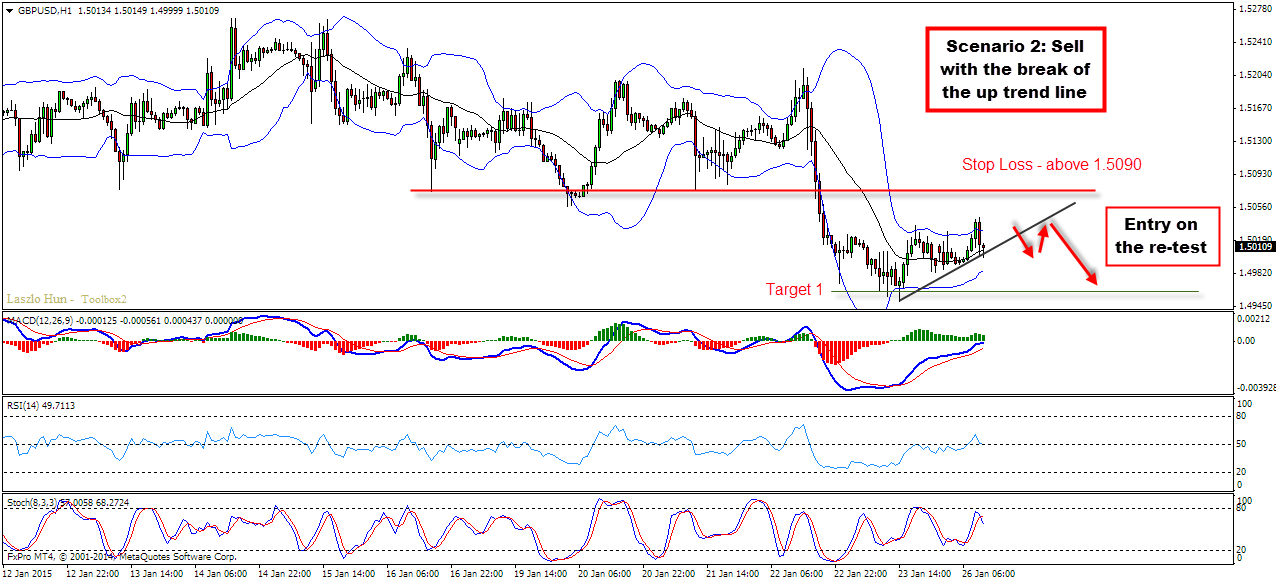
In the long run, looking at the weekly and daily chart we can see that the price is reaching a bottom. At least a temporary one and correction should follow. Until then though, we can use the intra-day momentum and try to find sell opportunities on the lower time frames. We have two ways to do that – selling with divergence around the resistance zone or selling with the break of the up trend line. Remember this trade setups are only valid as long as the price remains below the 1.5070-1.5090 resistance zone.
Technical Overview:
D1 – there is bullish divergence already present and the pair has reached the psychological support around 1.50
Entry:
H1 – in the shorter term another push down is possible so we are looking for a sell either with the break of the up trend line or around the top of the pattern that is forming on the H1 chart close to the resistance zone around 1.5070/90
Target 1: 1.4960
Target 2: 1.4900
Stop Loss: above 1.5090
I wish you successful week!
Vladimir
Hi Traders! Arvinth here from the Home Trader Club team. The weekly summary and, review of March…
Europe’s bonds will struggle to bounce back from a sharp selloff triggered by the war…
Hi Traders! GBPUSD short term forecast and technical analysis is here. We do our analysis…
Hi Traders! SP500 short term forecast update and follow up is here. On December 18th,…
Hi Traders! AUDNZD short term forecast and technical analysis is here. We do our analysis…
Hi Traders! USDJPY short term forecast update and follow up is here. On January 29th,…