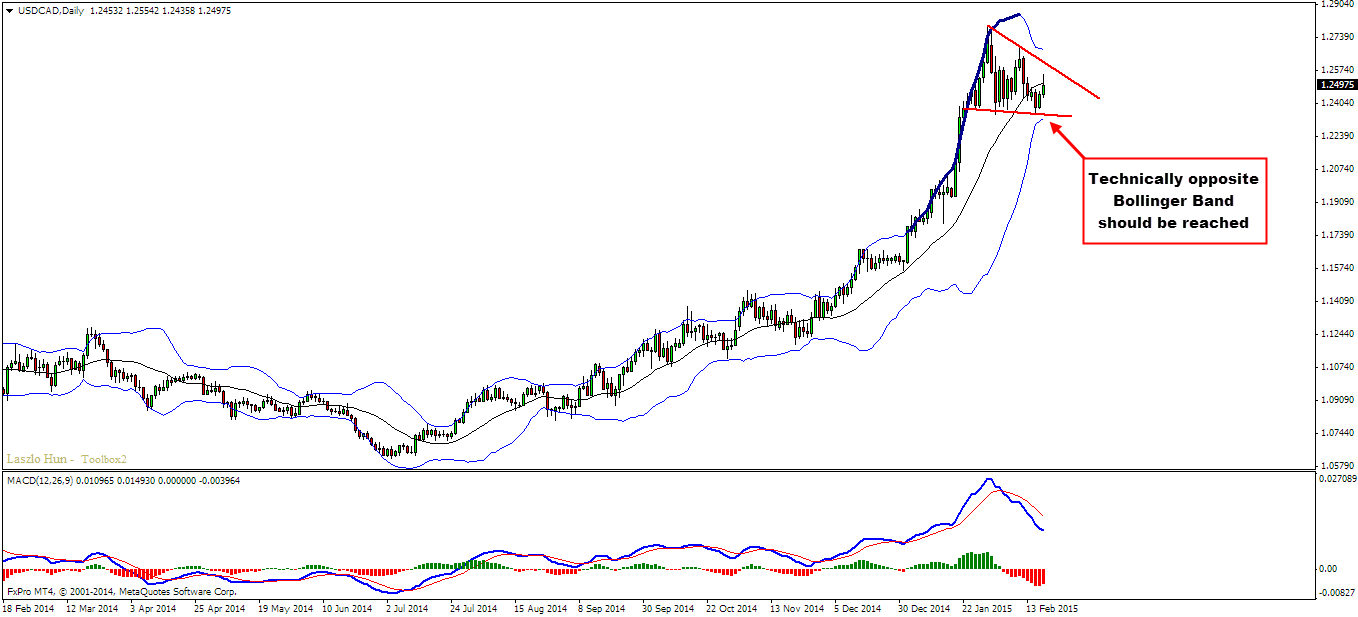
USDCAD failed to break the up trend line the first time and it continued higher. The plan remains the same, I’m still following the trend line and anticipating the break. Opposite bollinger band on the daily chart has not been reached yet which gives us extra confirmation that we should see the pair moving south.
Technical Overview:
D1: 20+ candles ride
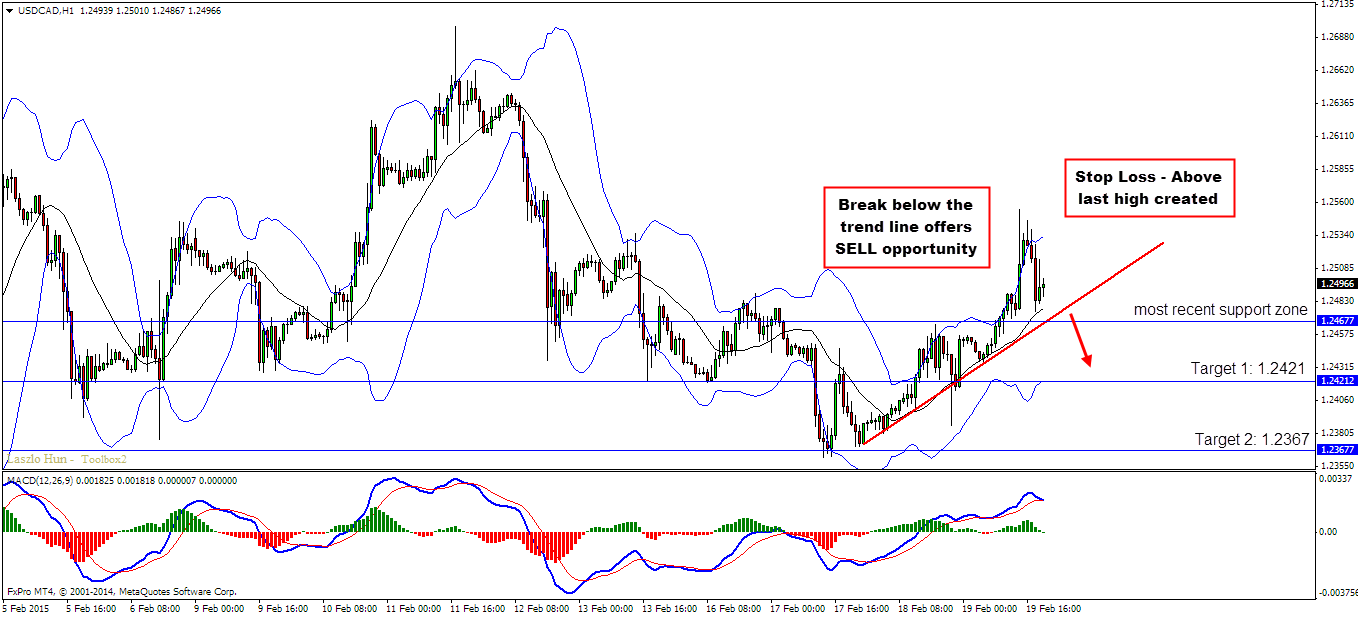
H1: up trend line
Entry:
H1: Wait for the break of the trend line and the most recent support zone (or last low) to go short with the momentum if present or alternatively wait for correction and enter on the correction.
Target 1: 1.2412
Target 2: 1.2336
Stop Loss: above the last high created before the break
Video Explanation:
Yours,
Vladimir
Hi Traders! USDJPY short term forecast update and follow up is here. On January 29th,…
Hi Traders! AUDCHF short term forecast and technical analysis is here. We do our analysis…
World markets rapidly reversed course on Monday after U.S. President Donald Trump said he will…
Hi Traders! Arvinth here from the Home Trader Club team. The weekly summary and, review of March…
Gold sank for a seventh session as the escalating war in the Middle East drove oil…
Hi Traders! EURGBP short term forecast and technical analysis is here. We do our analysis…