Before i discuss the USDJPY pair which i think offers great buy opportunity, let me remind you about the FOMC tomorrow meaning that we could see some false breaks and choppy market in general.
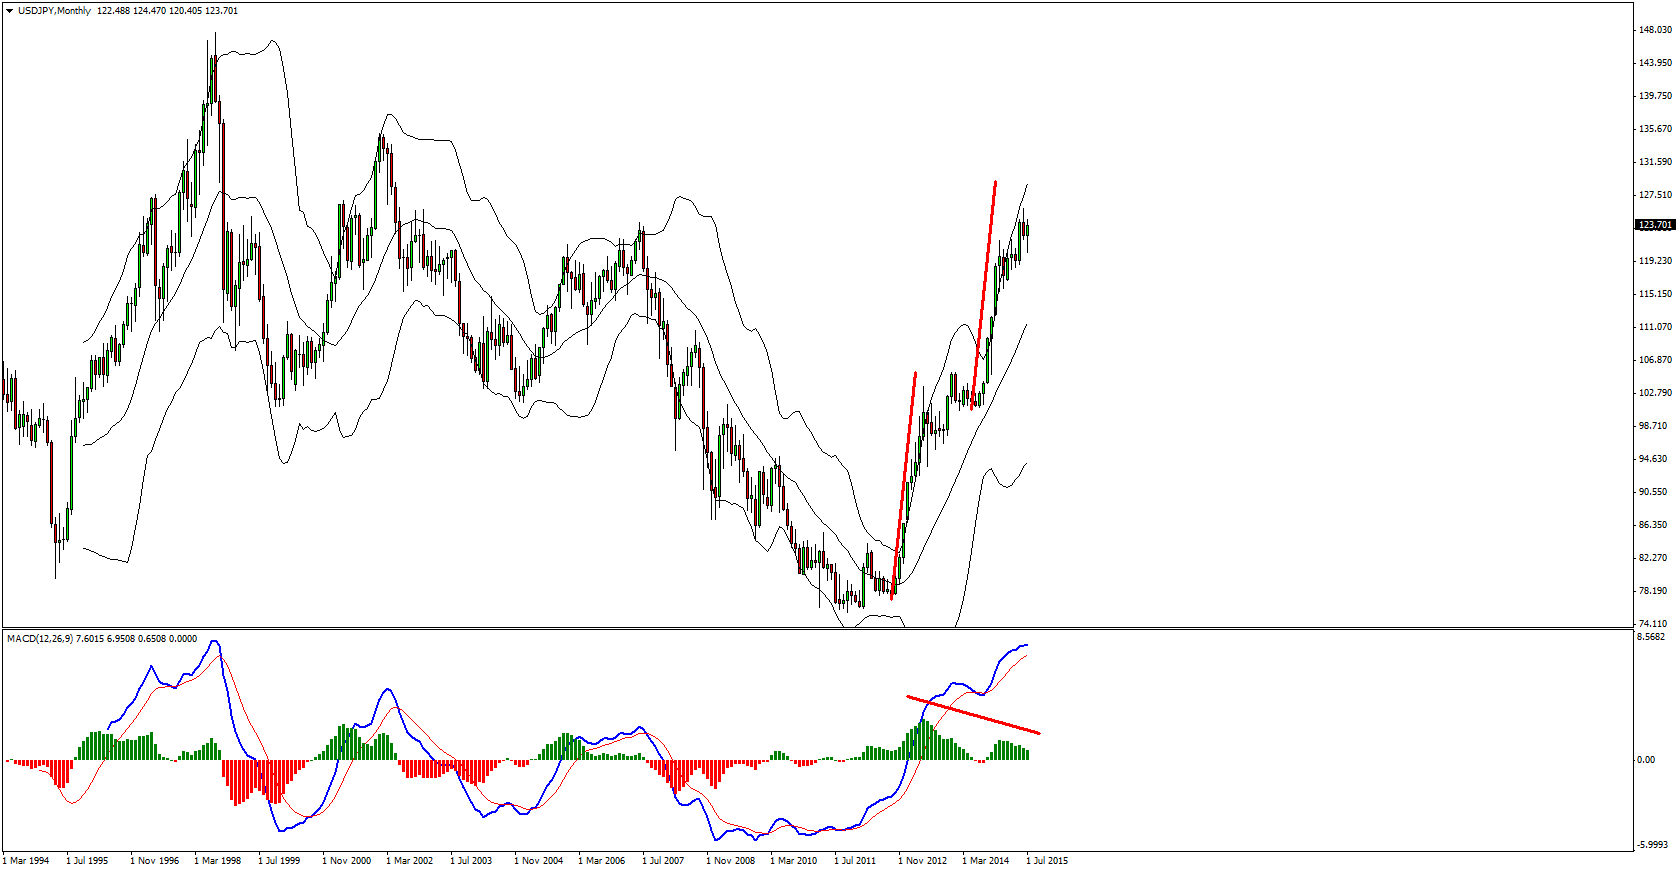
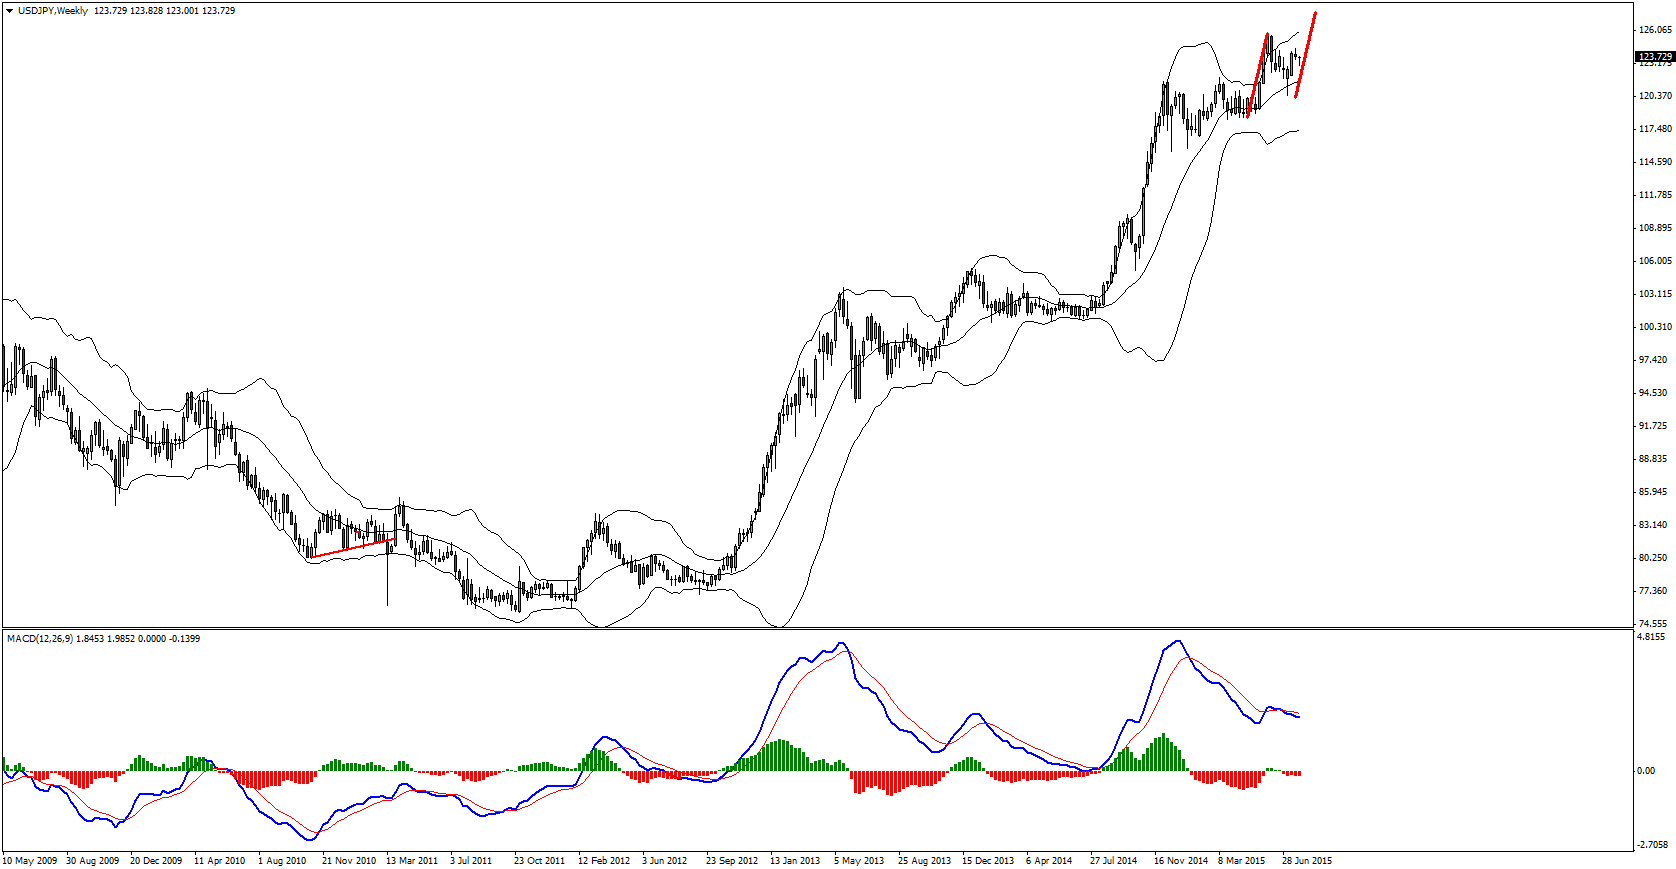
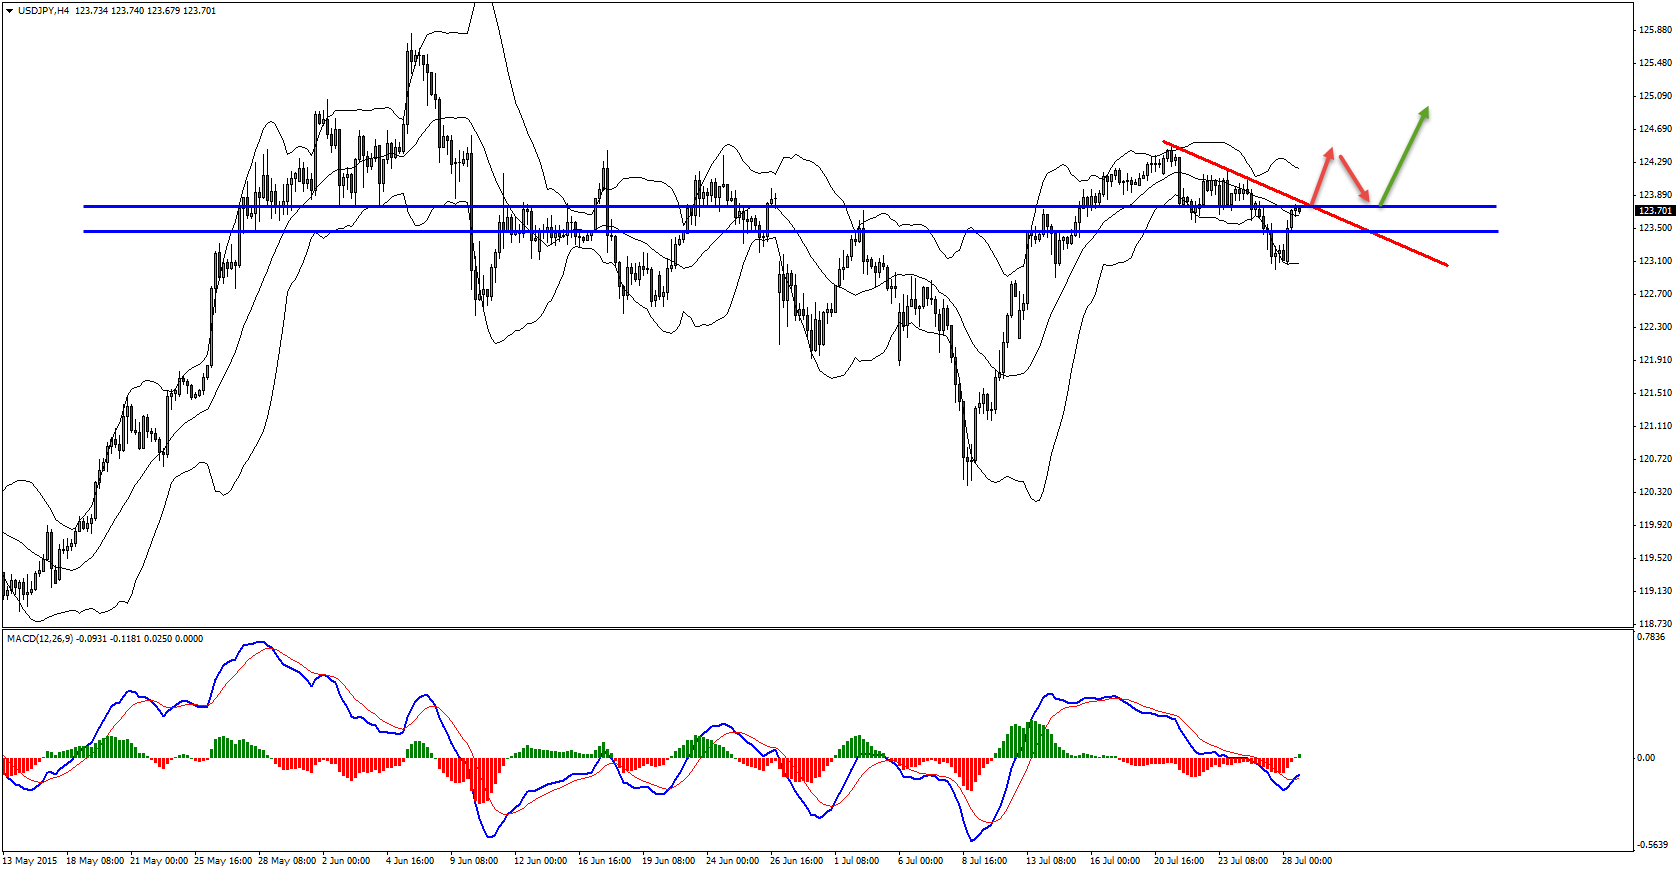
Now back to technical analysis. Looking at the monthly chart of dollar/yen we can see that it is currently into wave number two and it is already creating bearish divergence. Until this wave is completed though we can expect the pair to rally in the mid-short term. Dropping down to the weekly chart we can find again a second wave being potentially duplicated at the moment and the zone we should be focusing on is 127.00-128.00 or even higher. But until then i’m bullish. And the way to join is with the break of the current bearish trend line on the H4 chart.
Technical Analysis:
Monthly – Potential double wave duplication
Weekly – potential double wave duplication as well
H4 – Bearish trend line
Entry:
H4 – wait for the bearish trend line to be broken up along with the most recent resistance zone before going long.
Target 1: 124.40
Target 2: 125.60
Target 3: 127.50
Stop Loss: below the broken trend line and support zone (which was previously resistance)
Video Explanation:
Yours,
Vlad
Hi Traders! USDJPY short term forecast update and follow up is here. On January 29th,…
Hi Traders! AUDCHF short term forecast and technical analysis is here. We do our analysis…
World markets rapidly reversed course on Monday after U.S. President Donald Trump said he will…
Hi Traders! Arvinth here from the Home Trader Club team. The weekly summary and, review of March…
Gold sank for a seventh session as the escalating war in the Middle East drove oil…
Hi Traders! EURGBP short term forecast and technical analysis is here. We do our analysis…