Hi Traders! Weekly summary and review June 25th, 2021 is here. It is now time to recap and summarize the trade setups that we had during this week. Below you will find the short explanation of all the trade setups we had in this week and how it has currently developed now.
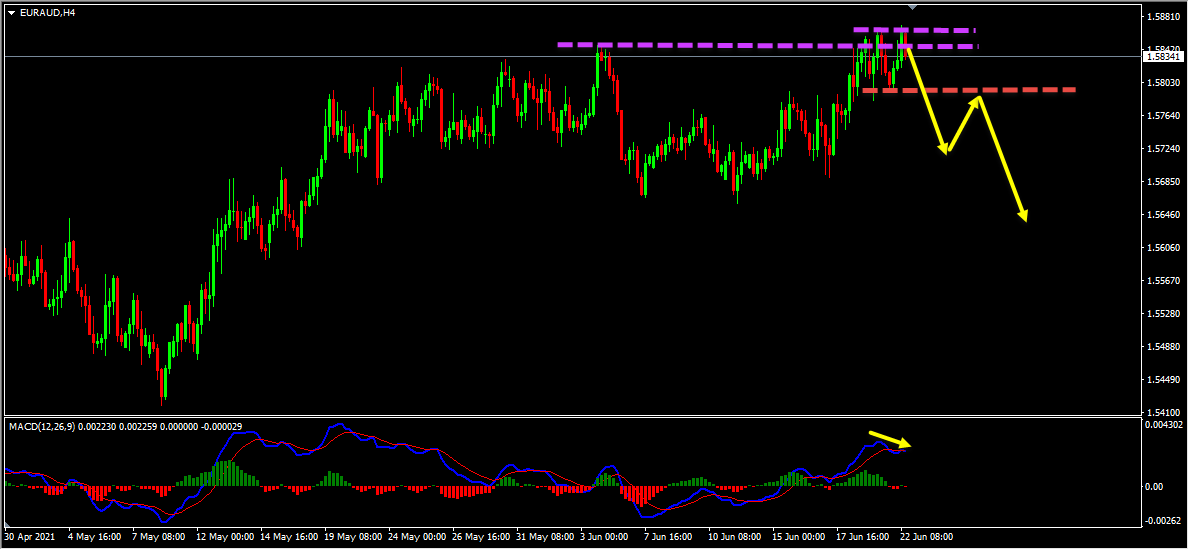
EURAUD – My idea here was “On the H4 chart, the price which is moving higher has created multiple false breaks with a bearish divergence between the first high that has formed at 1.58658 and the second high that has formed at 1.58712 which we may consider as evidences of bearish pressure. In my POV there are two possible scenarios from here, which are as follows:
Scenario 1
If the price moves lower and if we get a valid breakout below the low at 1.57929 we may then consider it as a validation for the bearish view, we may then expect the price to continue lower further.
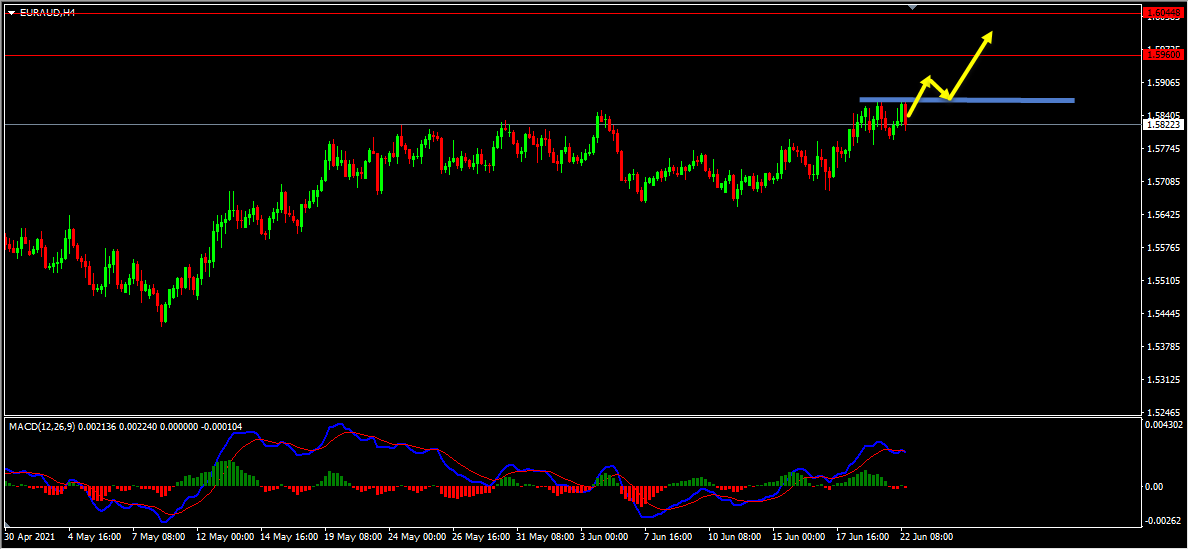
Scenario 2
Alternatively if the price moves higher with momentum and if we get a valid breakout above the high at 1.58712, we may then consider it as a validation for the short term bullish view. We may then expect the price to move higher towards the weekly resistance zone”.
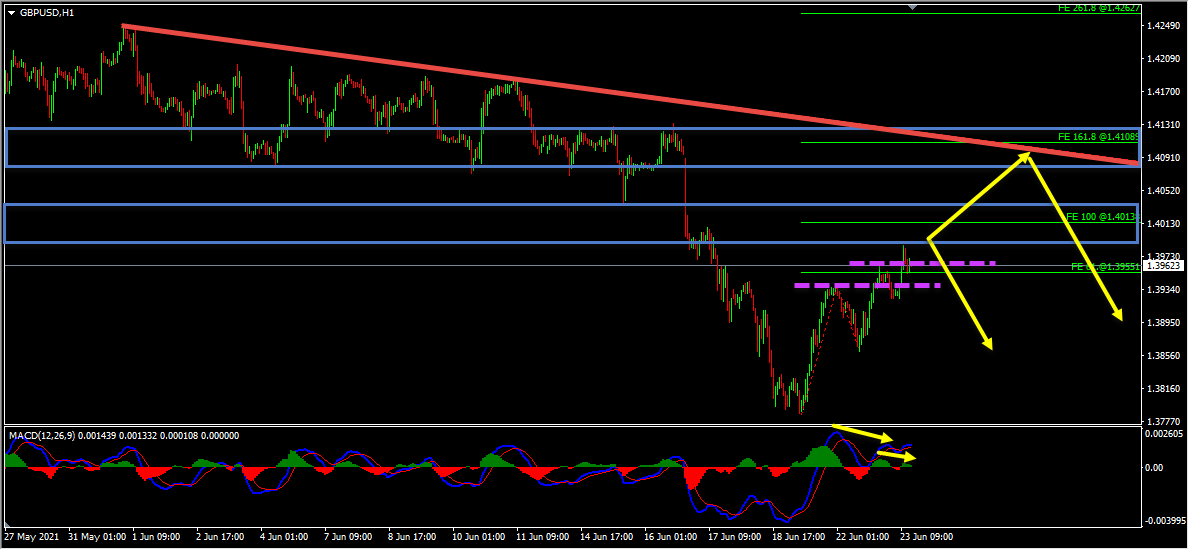
GBPUSD – My idea here was “On the H1 chart, the price has created multiple false breaks and bearish divergences between the first high that has formed at 1.39362 and the second high that has formed at 1.39869 which we may consider as evidences of bearish pressure. Also, while measuring the first wave of this correction using the Fibonacci expansion tool, we could see that the 100%(1.40138) Fibonacci expansion level of this first wave coincides with the first resistance zone on the H4 chart which makes this a key resistance zone for us. Also, we could see that the 161.8%(1.41089) Fibonacci expansion level of this first wave and the downtrend line coincides with the second resistance zone on the H4 chart which makes this area a second key resistance zone for us. Until both these key resistance zones hold my view remains bearish here and I expect the price to move lower further”.
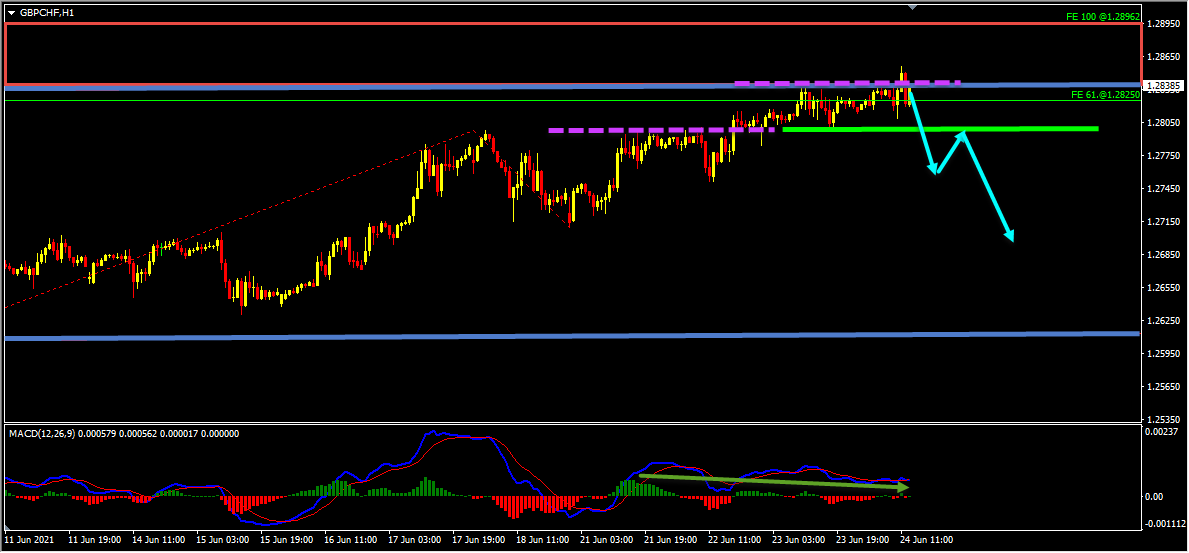
GBPCHF – My idea here was “On the H1 chart, the price which is moving higher has created multiple false breaks with a bearish divergence between the first high that has formed at 1.27985 and the second high that has formed at 1.28558 based on the MACD indicator which we may consider as evidences of bearish pressure. If the price moves lower and if we get a valid breakout below the low at 1.28000 we may then consider it as a validation for the bearish view and may expect the price to continue lower further. Alternatively if the price moves higher and if we get a valid breakout above the H4 key resistance zone then this bearish view will be invalidated”.
For similar trade ideas and much more I invite you to join the Traders Academy Club and improve your trading with us.
You will also find a pretty extensive database of educational materials here in the blog – just use the search or check out the Forex Education section above.
If you have any further questions, don’t hesitate to drop a comment below!
To your success,
Vladimir Ribakov
Certified Financial Technician
Hi Traders! USDCHF short term forecast update and follow up is here. On May 20th,…
Hi Traders! CADCHF short term forecast and technical analysis is here. We do our analysis…
The dollar was broadly steady on Monday as cautious investors watched out for signals on…
Hi Traders! Arvinth here from the Home Trader Club team. The weekly summary and, review of July…
European markets edged lower on Thursday following more overnight volatility in Asia’s tech-dominated indexes, while…
Hi Traders! EURGBP short term forecast and technical analysis is here. We do our analysis…