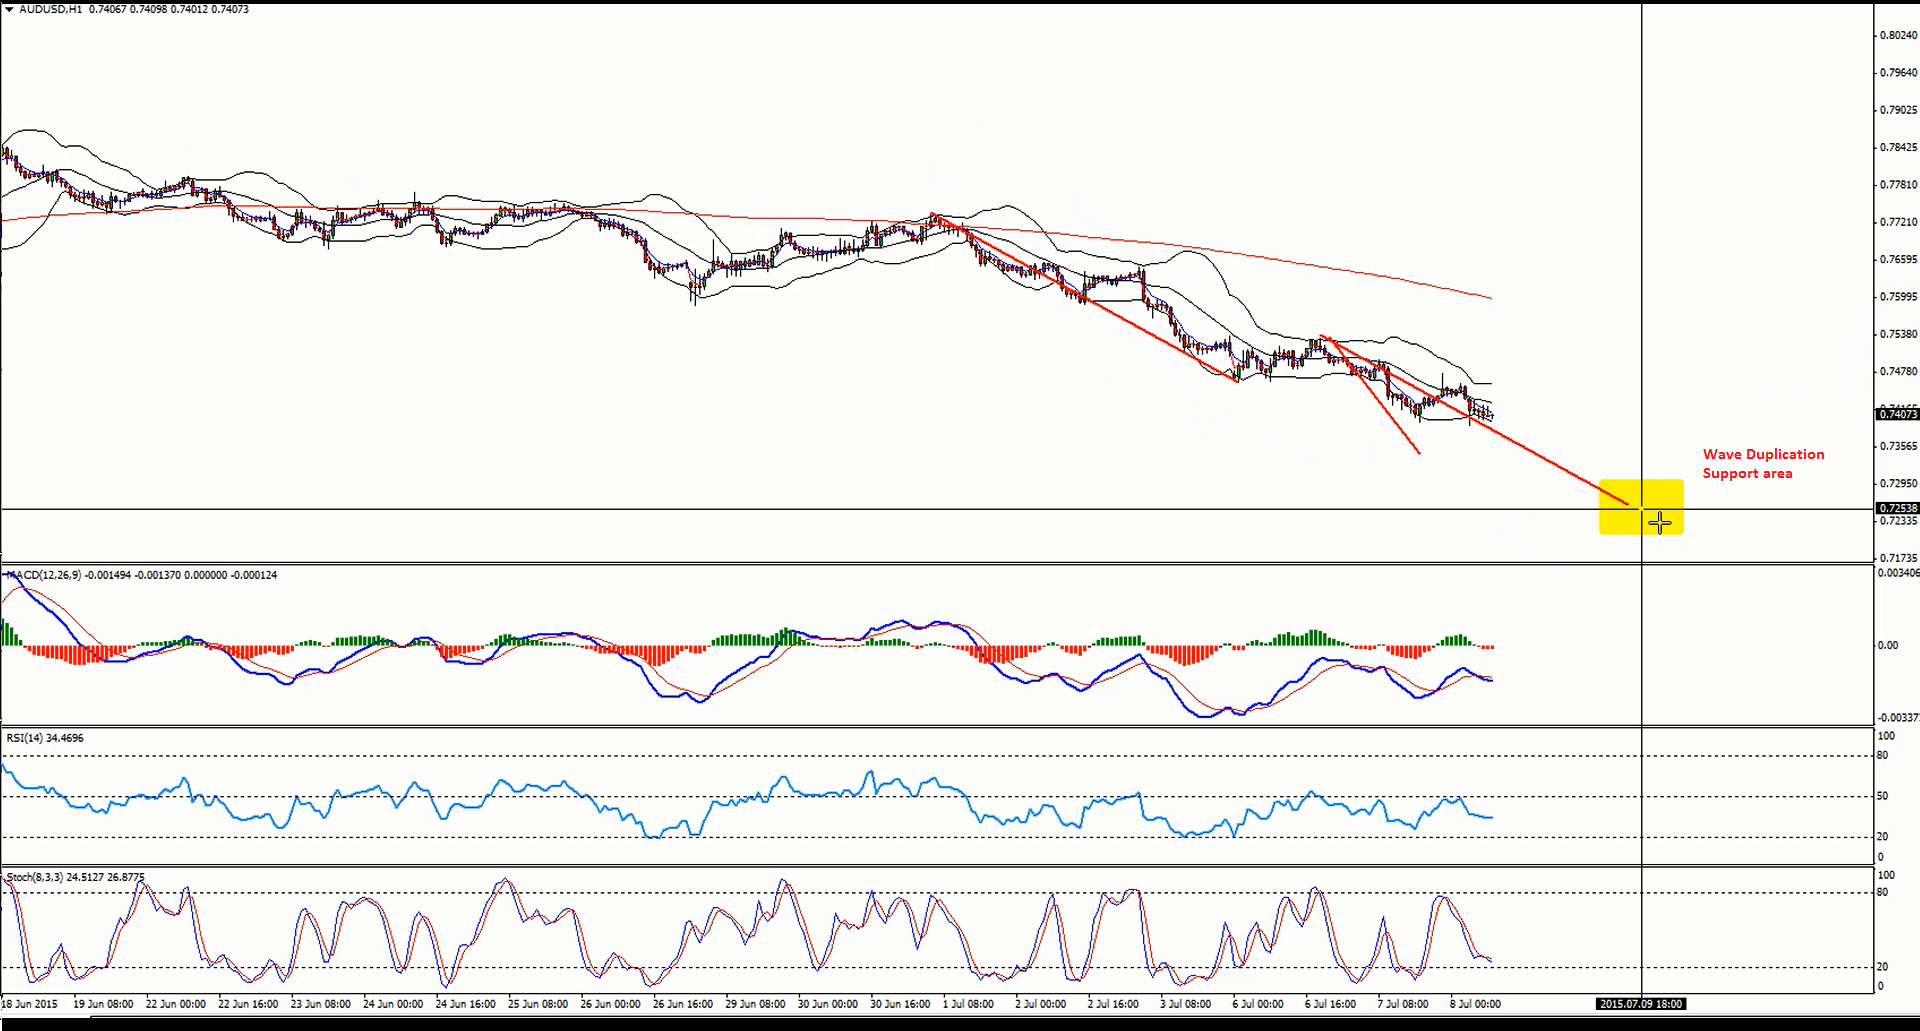
The Aussie Dollar traded lower earlier during the Asian session against the US dollar. However, it looks like the AUDUSD pair might find buyers on the way down. If we have a close look at the charts, then there is a possibility of a wave duplication pattern on the hourly chart that might find support around 0.7250-80.
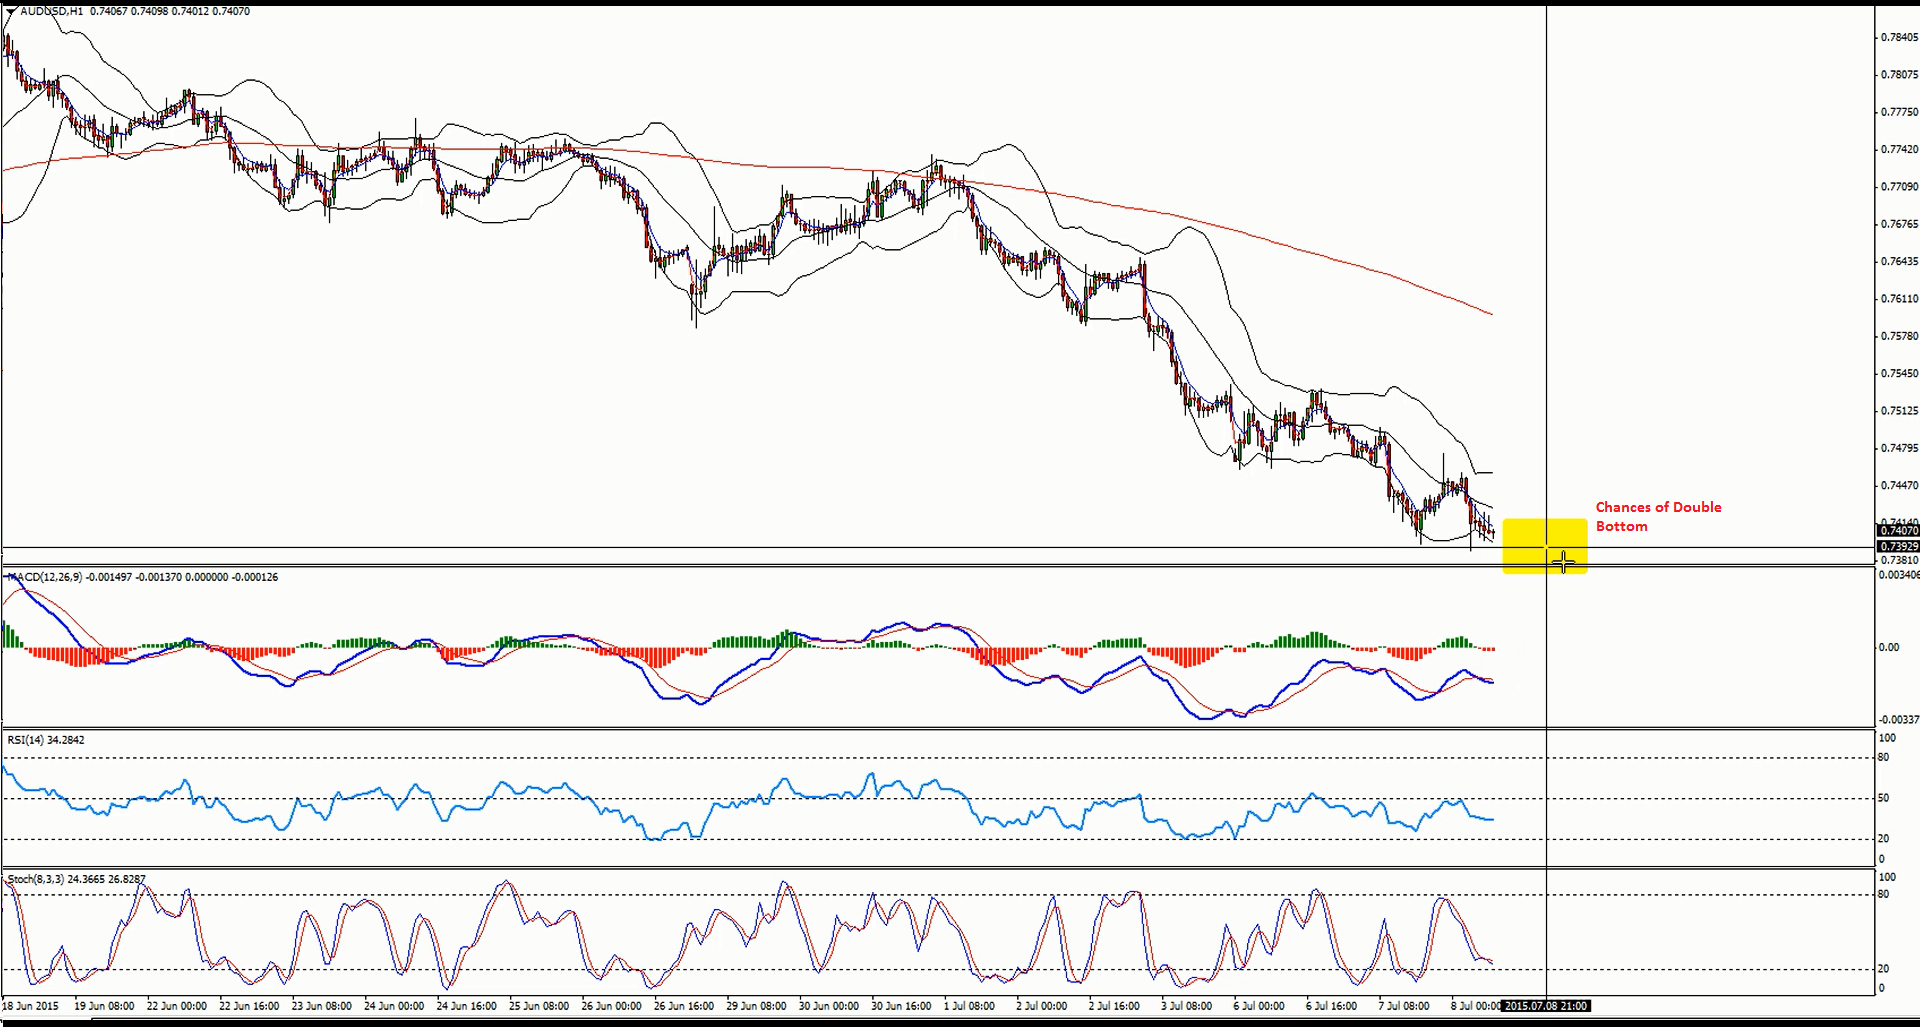
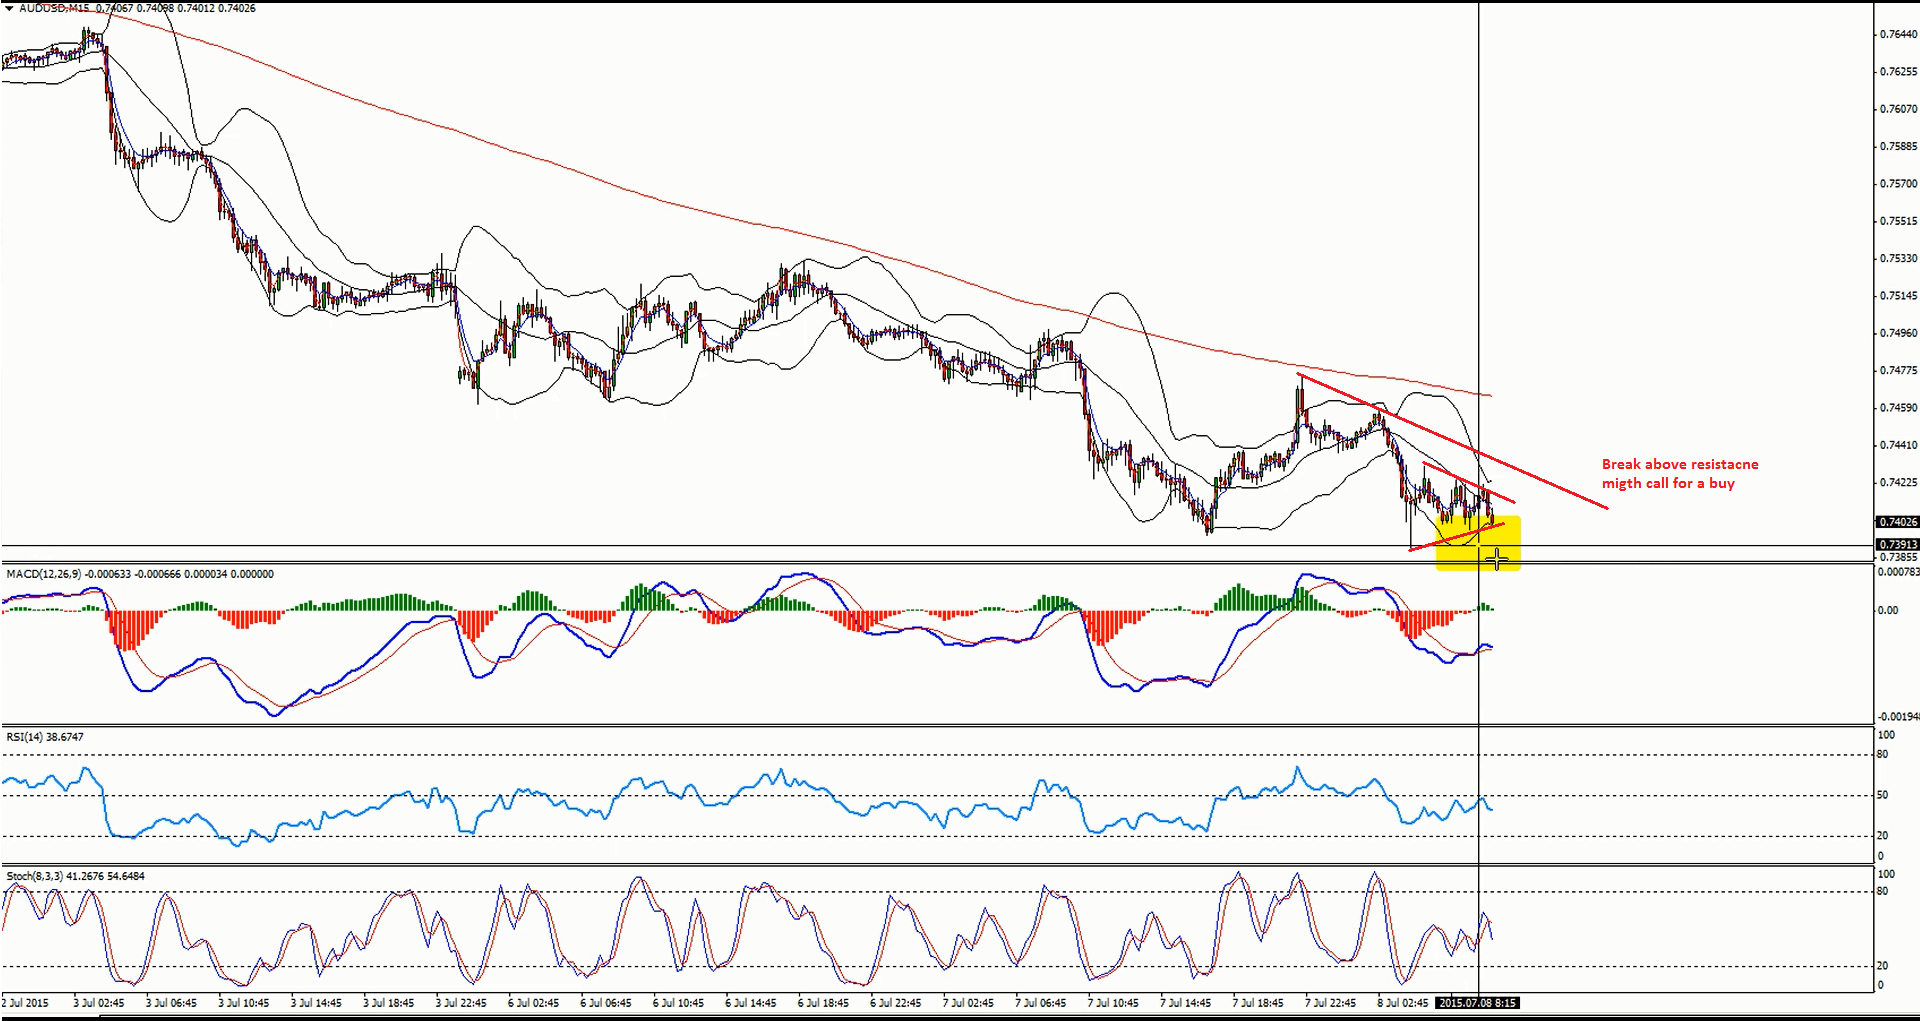
Moreover, there is a chance that the pair is forming a double bottom pattern. In this case, we should be looking for buy opportunities if the pair breaks above a major bearish trend line on 15-minutes chart.
Technical Analysis:
H1 – Potential Wave duplication pattern forming on the hourly chart.
H1 – Potential double bottom pattern forming on the hourly chart to support buyers.
Entry:
M15 – We can enter a buy trade if the AUDUSD pair breaks the highlighted triangle pattern and the bearish trend line as shown in the 15-minutes chart.
Target 1: 0.7480
Target 2: 0.7520
Stop Loss: Below the recent low around 0.7390.
Video Explanation:
Europe’s bonds will struggle to bounce back from a sharp selloff triggered by the war…
Hi Traders! GBPUSD short term forecast and technical analysis is here. We do our analysis…
Hi Traders! SP500 short term forecast update and follow up is here. On December 18th,…
Hi Traders! AUDNZD short term forecast and technical analysis is here. We do our analysis…
Hi Traders! USDJPY short term forecast update and follow up is here. On January 29th,…
Hi Traders! AUDCHF short term forecast and technical analysis is here. We do our analysis…