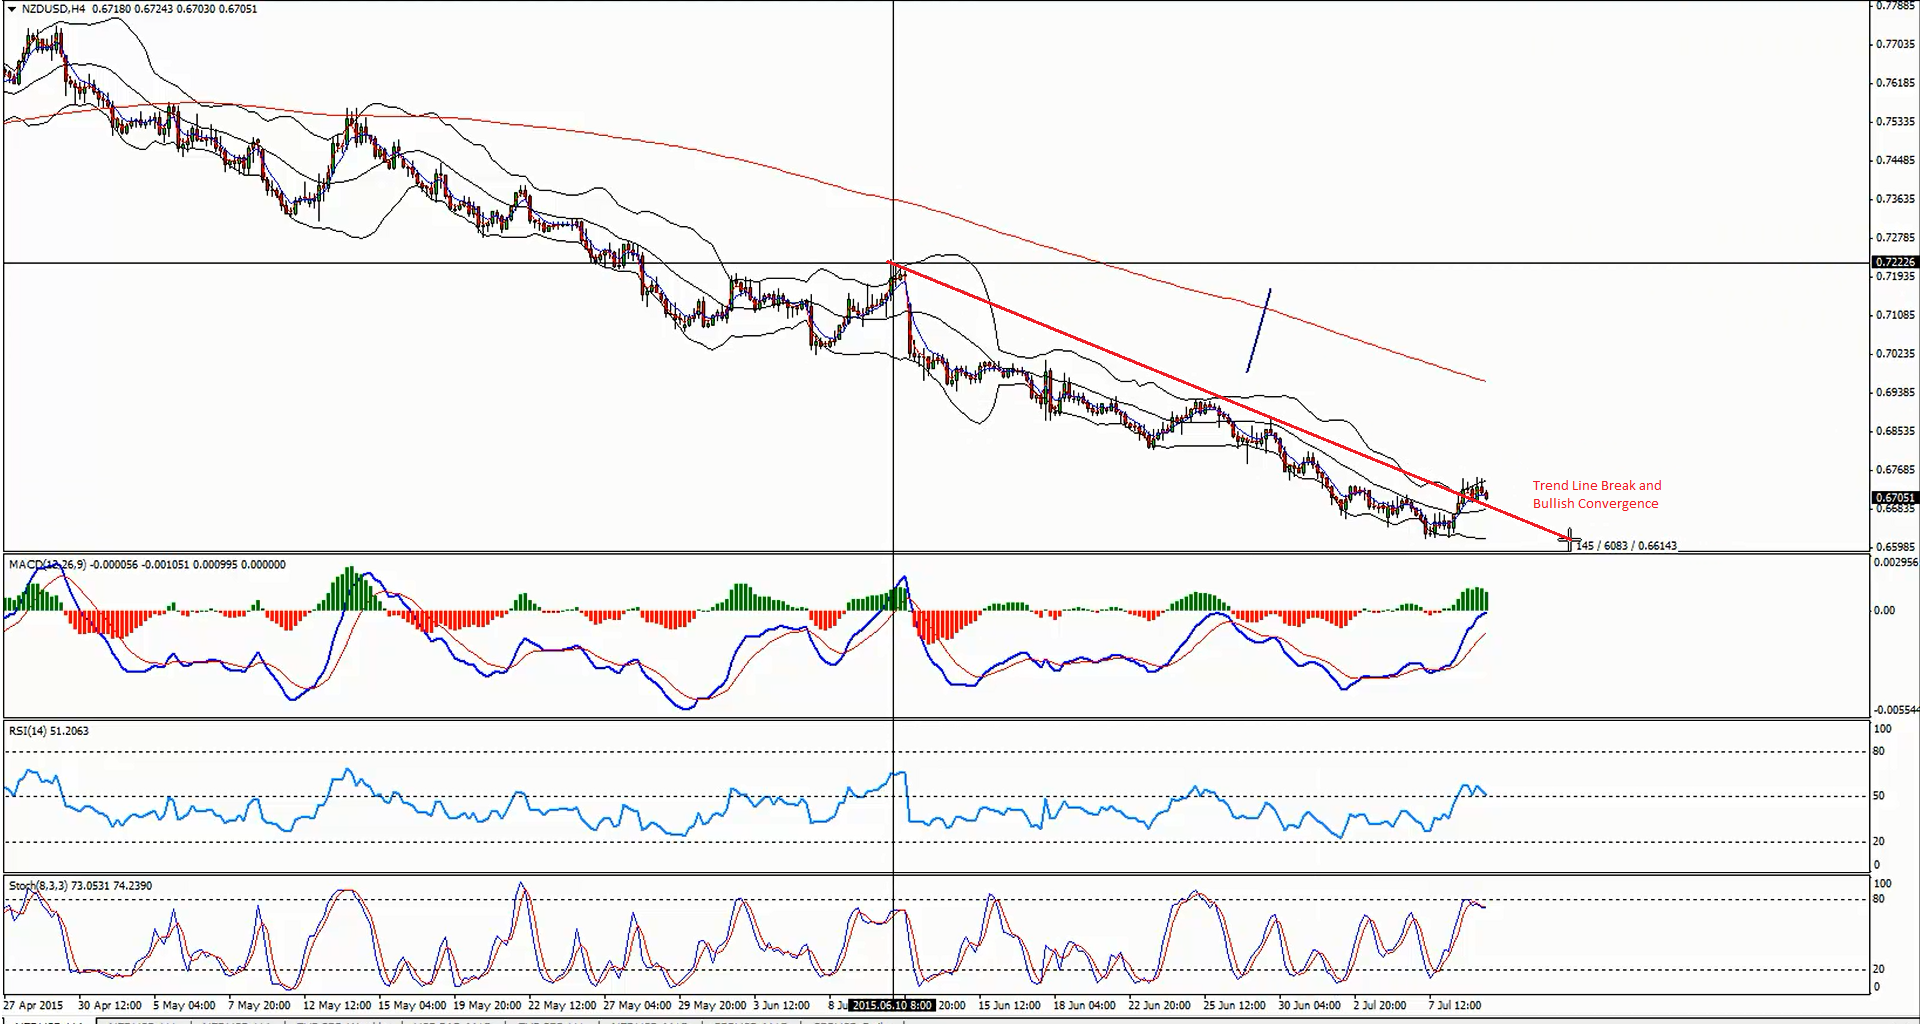
The Kiwi dollar suffered heavy losses recently against the US Dollar, and traded lower close to 0.6600. However, the NZDUSD pair managed to find buyers around the mentioned area and currently correcting higher. There is a bullish convergence formed on the 4-hours chart, and there is a bearish trend line break noted as well to open the doors for more upsides. So, let’s look for buy opportunities.
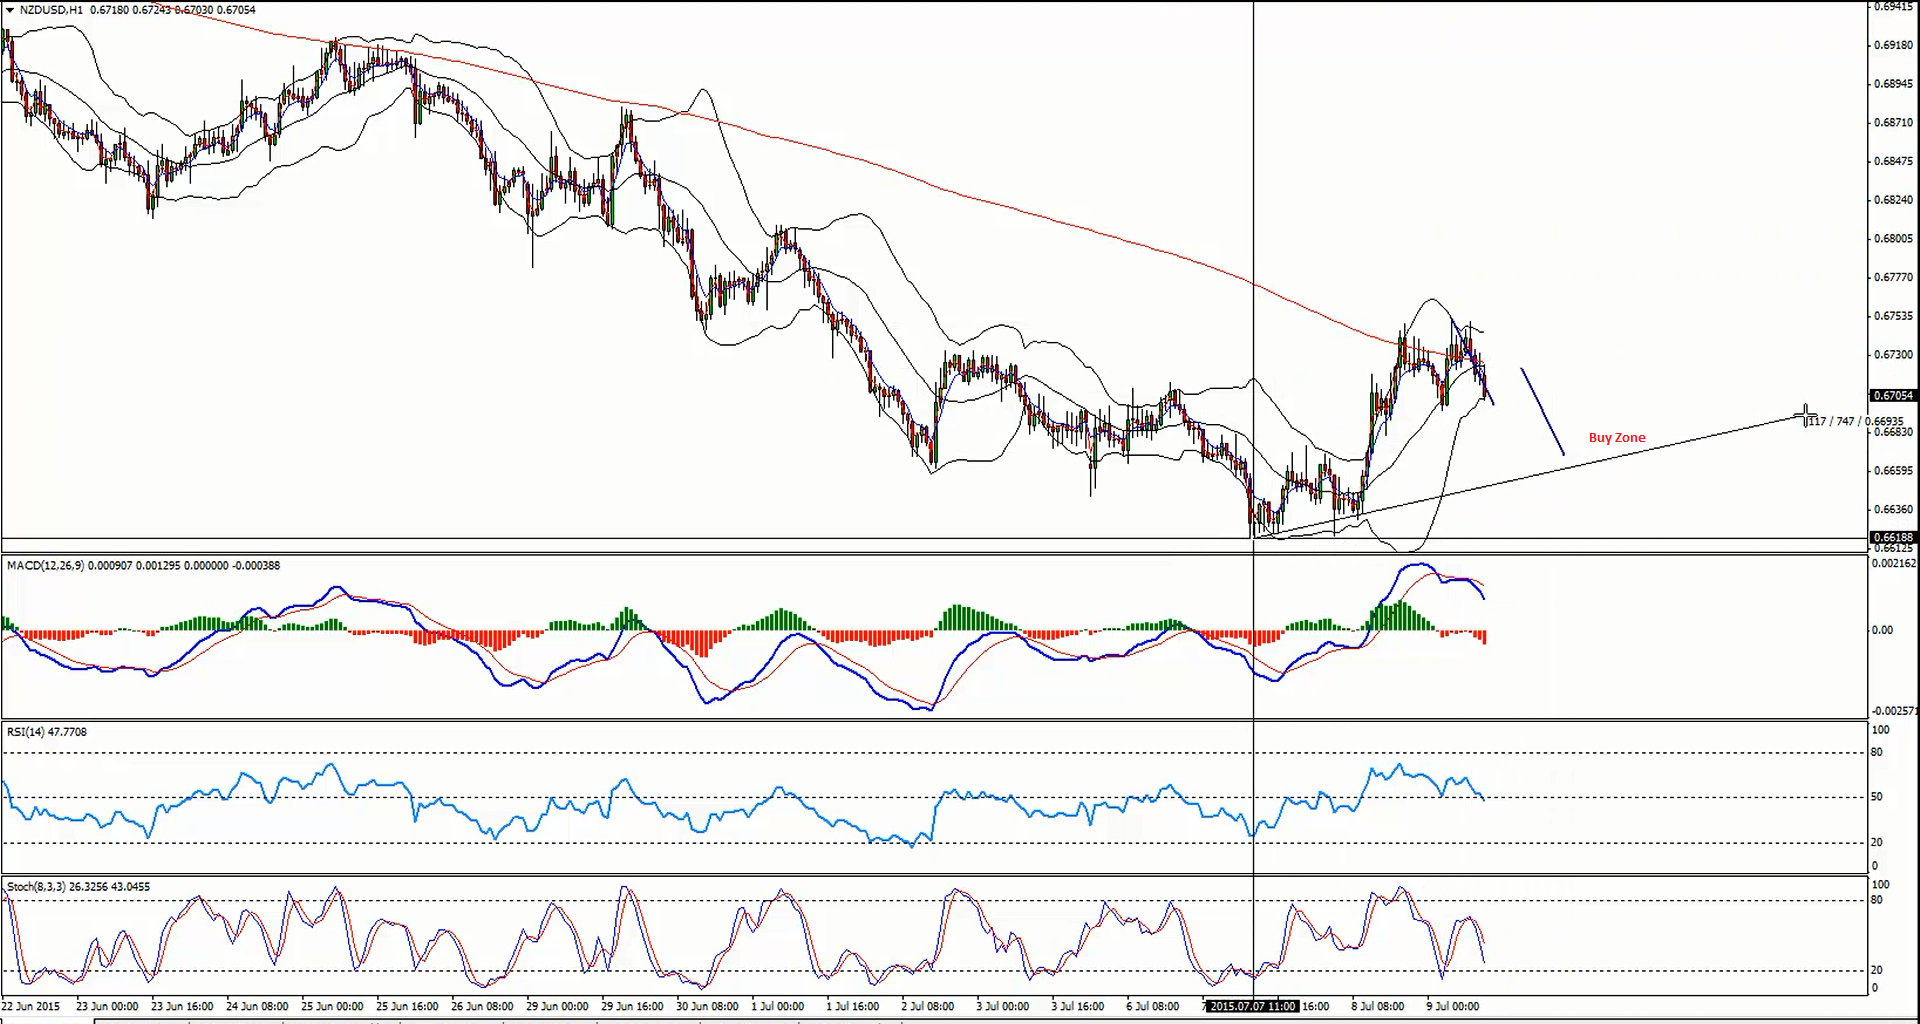
If the pair corrects in three waves lower and trades near a bullish trend line on the hourly chart, then we can enter a buy trade.
Technical Analysis
H4 – There is a trend line break noted, and a bullish convergence forming as well.
Entry:
H1 – We can enter a buy trade if the NZDUSD pair corrects in three waves lower and trades near a bullish trend line on the hourly chart.
Target 1: 0.6750
Target 2: 0.6800
Stop Loss: Below the highlighted support trend line on the hourly chart.
Video Explanation:
Yours,
Vlad
Hi Traders! Arvinth here from the Home Trader Club team. The weekly summary and, review of July…
U.S. stock indexes hit multi-week lows on Thursday, as concerns over heavy AI spending resurfaced…
Hi Traders! GBPUSD short term forecast and technical analysis is here. We do our analysis…
Hi Traders! Ethereum short term forecast follow-up and update is here. On May 26th, 2026…
Hi Traders! GBPAUD short term forecast and technical analysis is here. We do our analysis…
Hi Traders! USDCHF short term forecast update and follow up is here. On May 20th,…