Hi Traders! CHFJPY forecast follow up and update is here. On June 17th I shared this “CHFJPY Technical Analysis And Forecast” post in our blog. In this post, let’s do a recap of this setup and see how it has developed now. If you would like to learn more about the way we trade and the technical analysis we use then check out the Traders Academy Club. Spoiler alert – free memberships are available!
My Idea
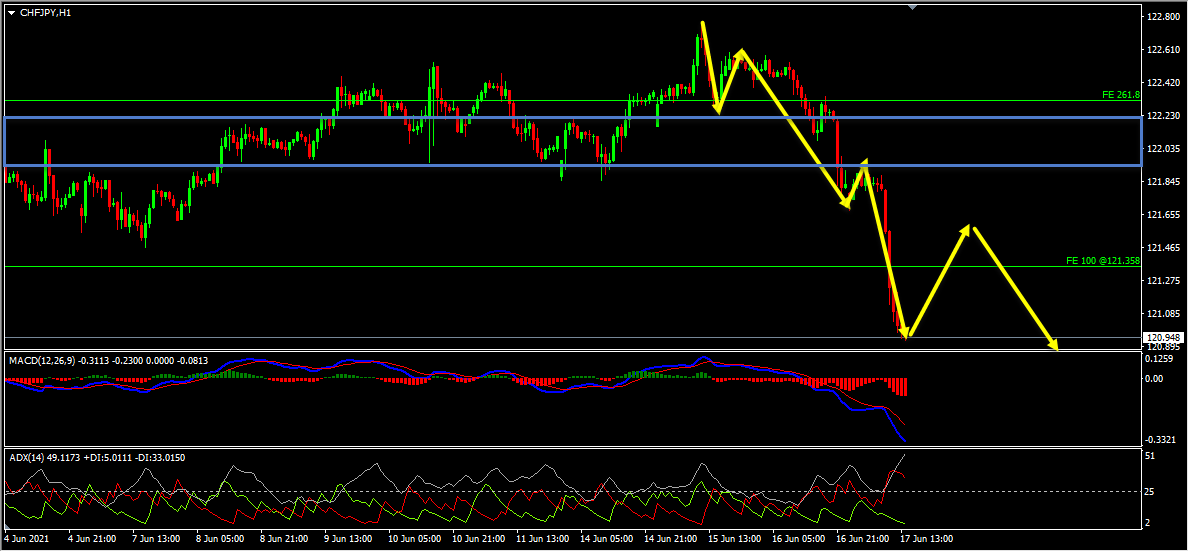
On the H1 chart the price which is moving lower has created a bearish trend pattern in the form of three lower highs, lower lows which we may consider as evidence of bearish pressure. Generally, after a bearish trend pattern, we may expect corrections and then further continuation lower. Also, the ADX indicator gave a bearish signal here as well at the cross of -DI (red line) versus +DI (green line), and the main signal line (silver line) reads value over 25, we may consider this as yet another evidence of bearish pressure. Until the strong resistance zone (marked in blue) shown in the image below holds my view remains bearish here and I expect the price to move lower further.
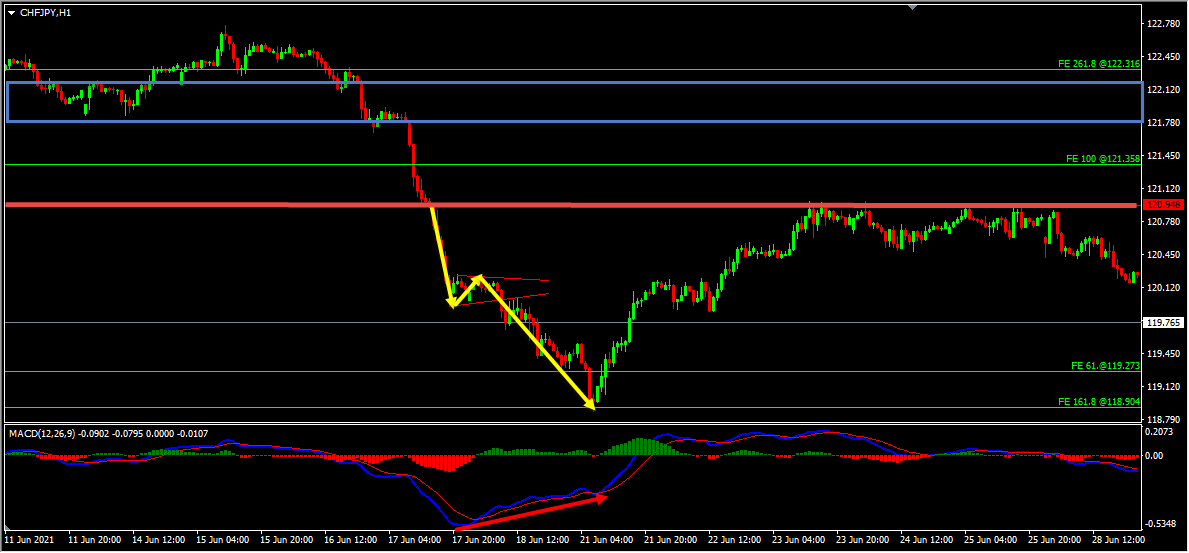
In this pair based on the multi-timeframe analysis my view was bearish and I was expecting the price to move lower further until the strong resistance zone holds. The price action followed my analysis here and moved lower directly without pullbacks, providing around 200 pips move until it was blocked a bullish divergence.
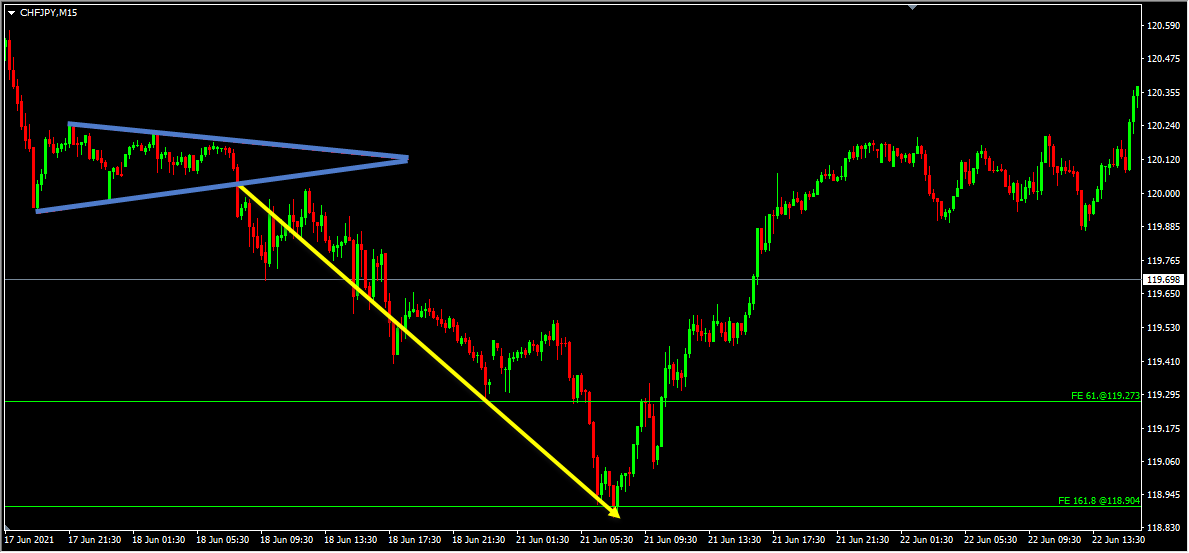
You can see this clearly on the M15 chart below.
Not sure how to enter a trade? Spot reversals (bounces)? Not sure how to spot breakouts?
I invite you to join us in our live market analysis, on daily basis, and improve your trading with us.
Also, you can get one of our strategies free of charge. You will find all the details here
If you have any further questions, don’t hesitate to drop a comment below!
Happy Trading!
Yordan Kuzmanov
Chief Trader at the Traders Academy Club
Hi Traders! Gold short term forecast update and follow up is here. On February 5th,…
Hi Traders! Dax short term forecast and technical analysis is here. We do our analysis…
Hi Traders! NZDUSD short term forecast and technical analysis is here. We do our analysis…
We are pleased to officially announce our new partnership with AvaTrade, one of the most…
Hi Traders! EURUSD short term forecast and technical analysis is here. We do our analysis…
Welcome to this week’s Forex forecast. In this analysis, we break down the key technical…
View Comments
Thank you sir