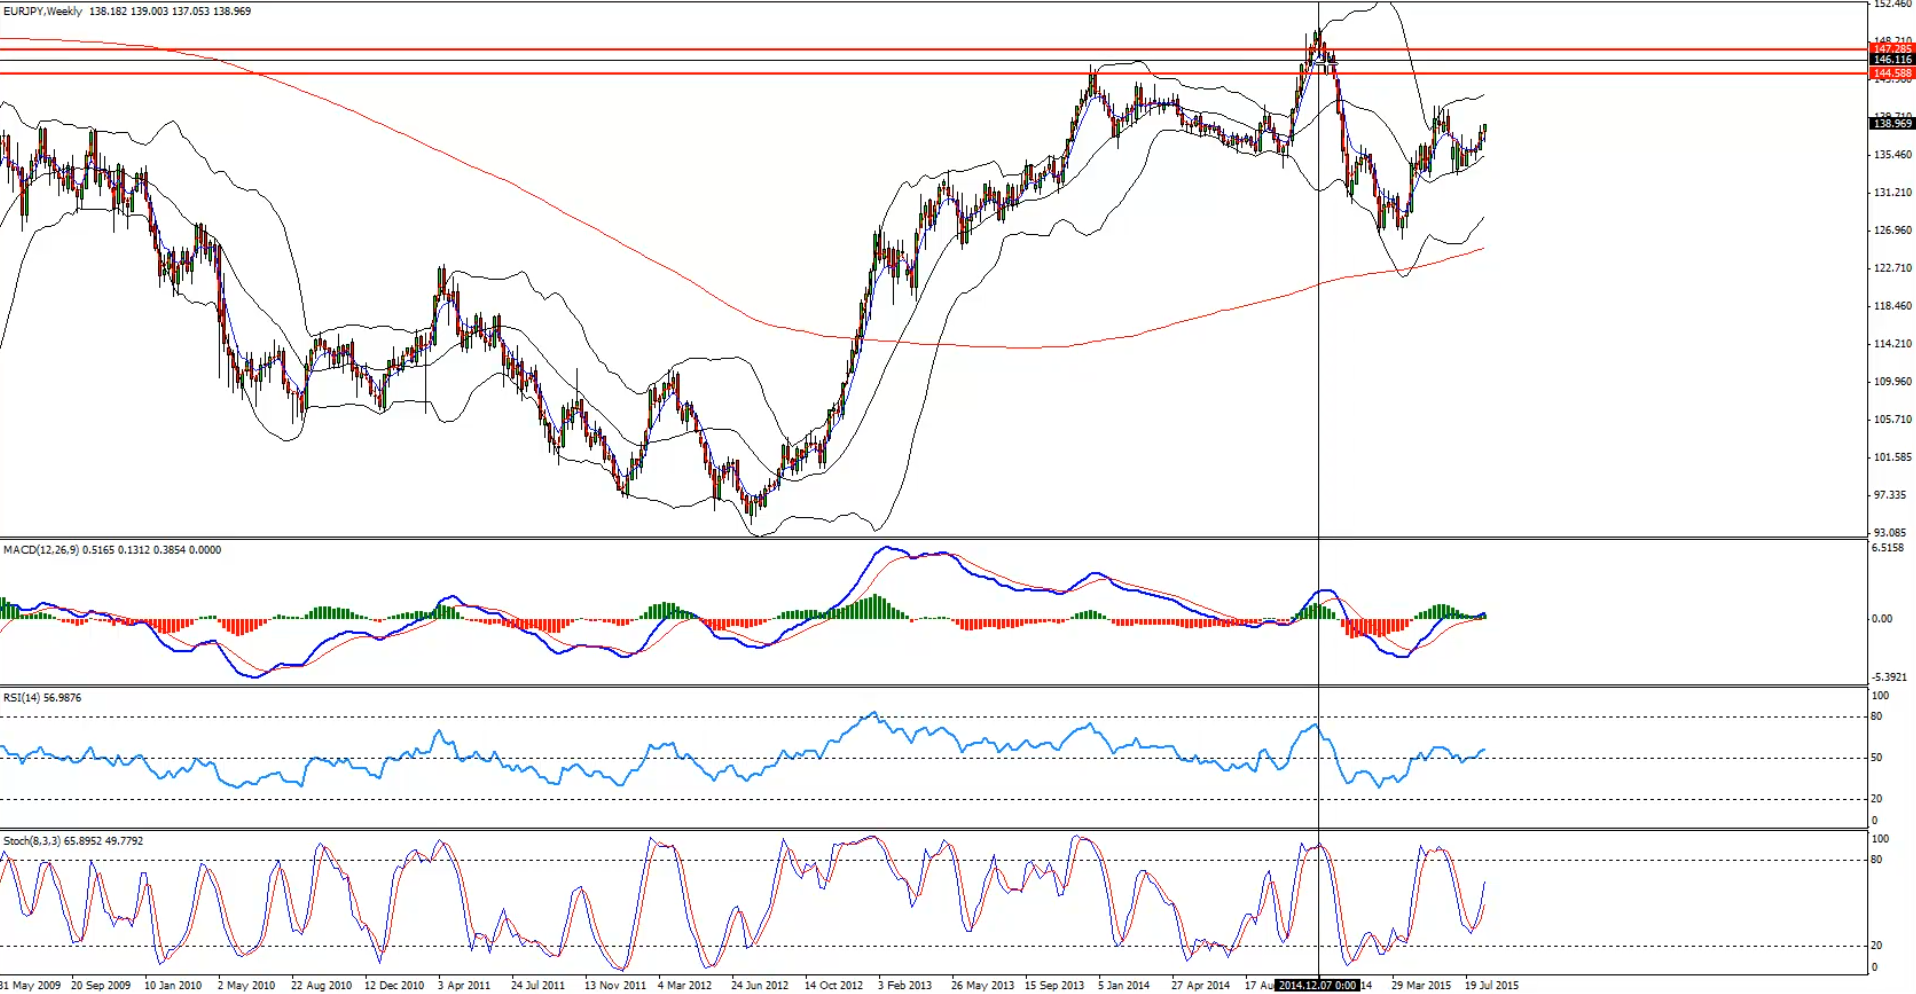
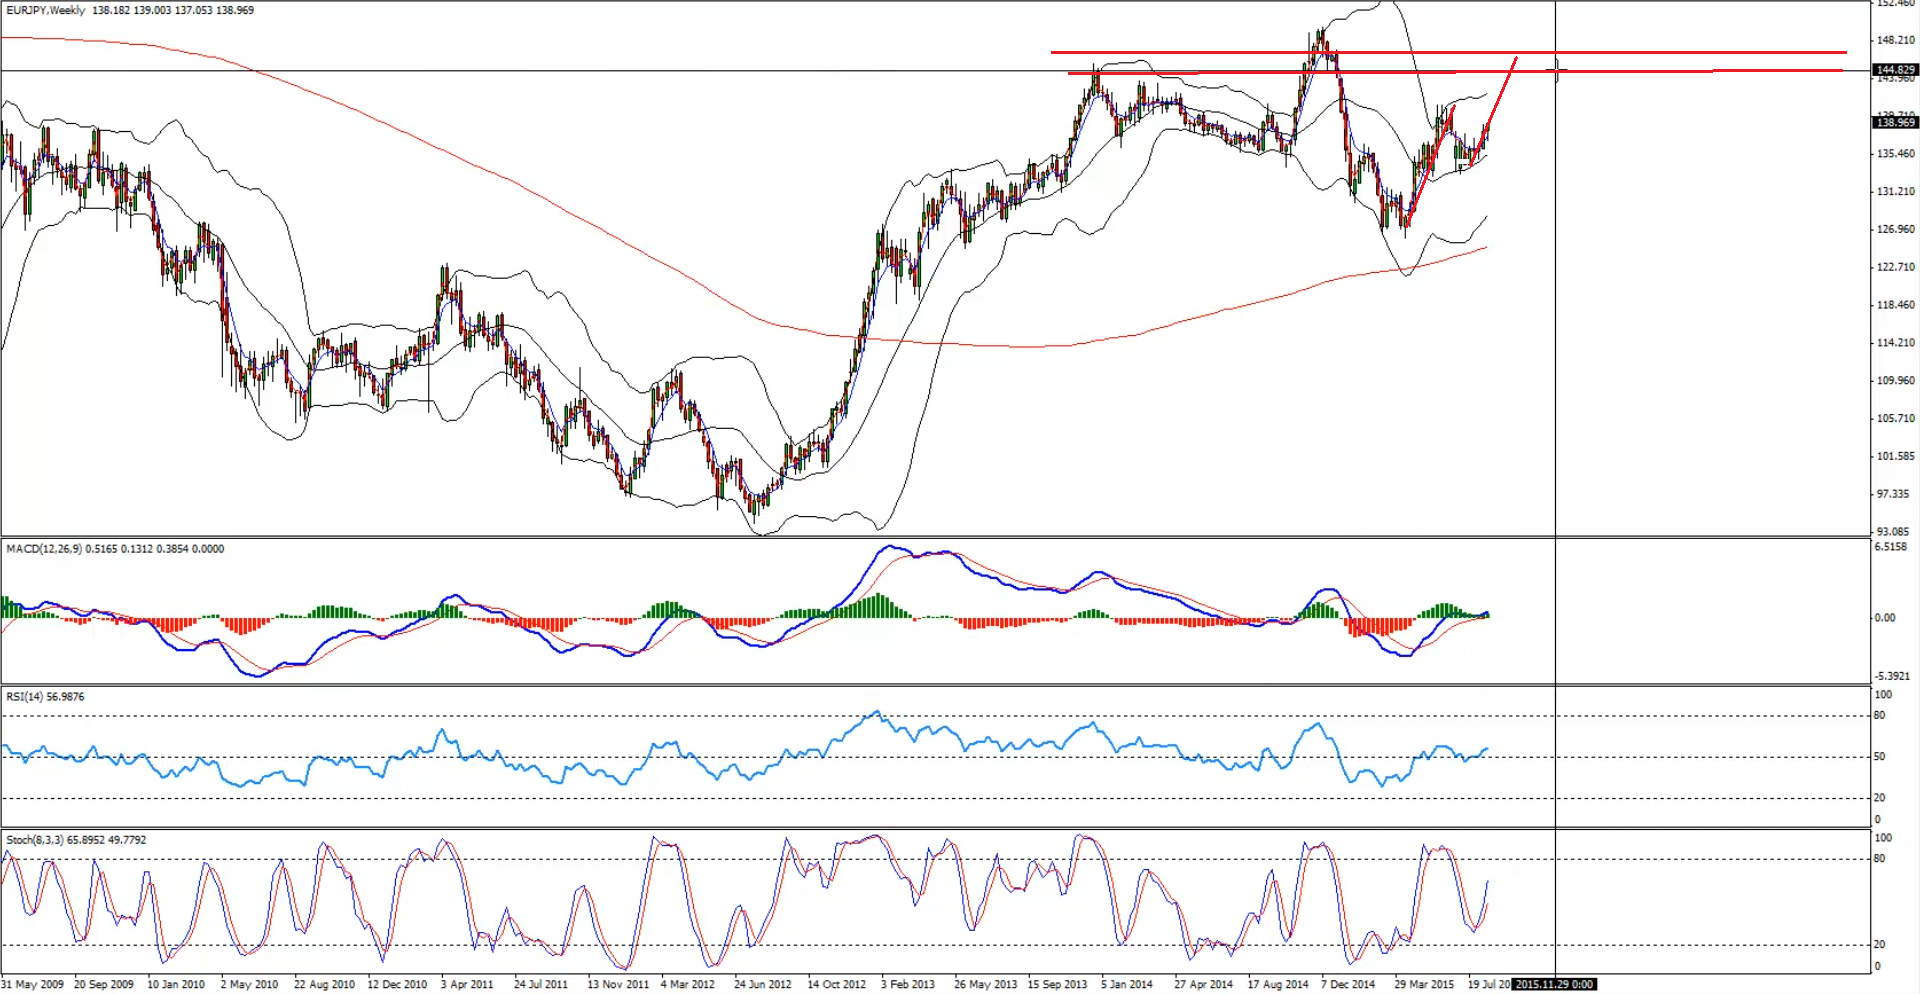
The Euro enjoyed a good bull run recently not only against the US Dollar, but also against the Japanese Yen. The EURJPY pair traded higher and broken a critical resistance area of 138.00. However, it is heading towards a monster resistance area where sellers could appear. There is a chance of a wave duplication on the weekly chart, which might complete around the highlighted major resistance of 144.00-145.00.
So, I think we should wait for the pair to make the next move, and if trades closer to the stated resistance area we may look for a sell opportunity.
Technical Analysis
W1 (weekly)– Chart highlighting a major resistance area around 144.00-145.00.
Entry:
D1/H4– We can enter a sell trade in the EURJPY pair if it moves higher from the current levels and trades closer to the 144.00-145.00 resistance area. Once this level is reached we should look for sell setups.
Target 1: 140.00
Target 2: 138.00
Stop Loss: Above 150.00 or the last high created once we enter into a sell trade
Video Explanation:
Yours,
Vladimir
Hi Traders! Arvinth here from the Home Trader Club team. The weekly summary and, review of March…
Europe’s bonds will struggle to bounce back from a sharp selloff triggered by the war…
Hi Traders! GBPUSD short term forecast and technical analysis is here. We do our analysis…
Hi Traders! SP500 short term forecast update and follow up is here. On December 18th,…
Hi Traders! AUDNZD short term forecast and technical analysis is here. We do our analysis…
Hi Traders! USDJPY short term forecast update and follow up is here. On January 29th,…