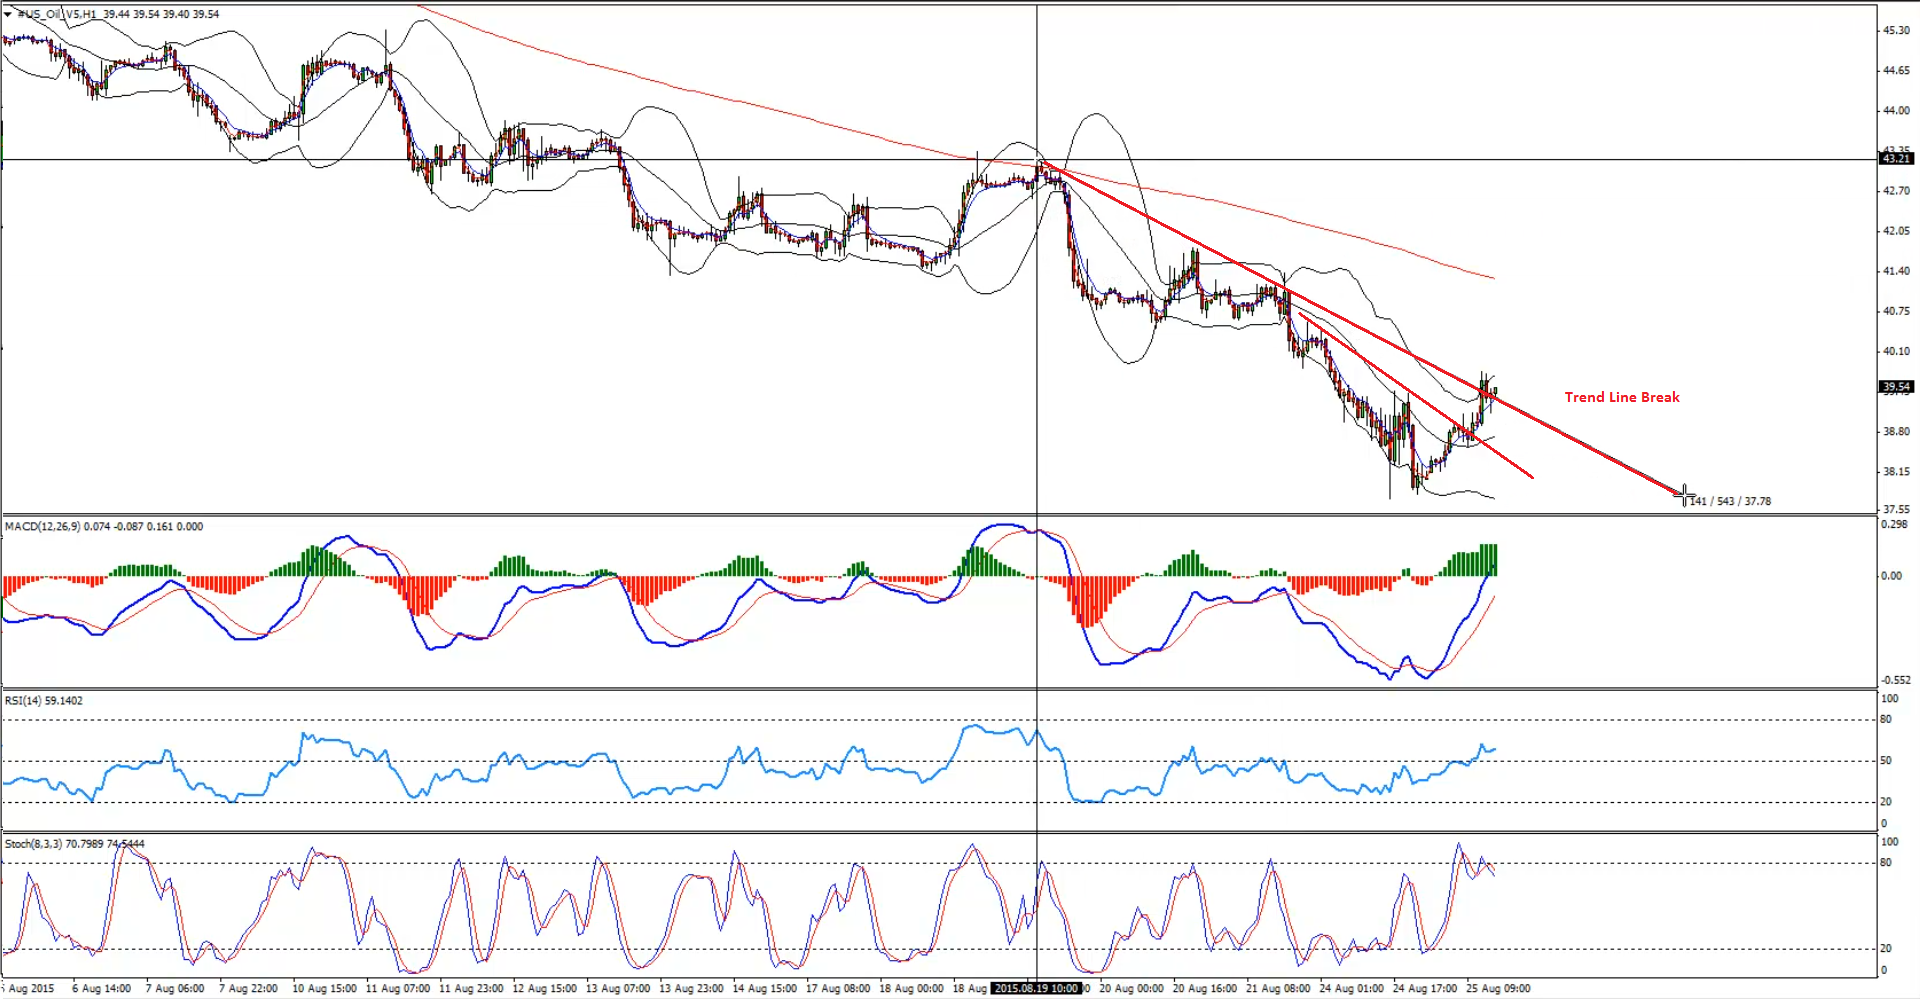
OIL recently fell sharply, but found support around the $38.00 area. The price is now moving higher, and it looks like there might be a nice buying opportunity. There was a minor bearish trend line on the hourly chart, which was cleared to open the doors for more gains in the near term. Currently, the price is around another trend line, and looks poised to settle above it.
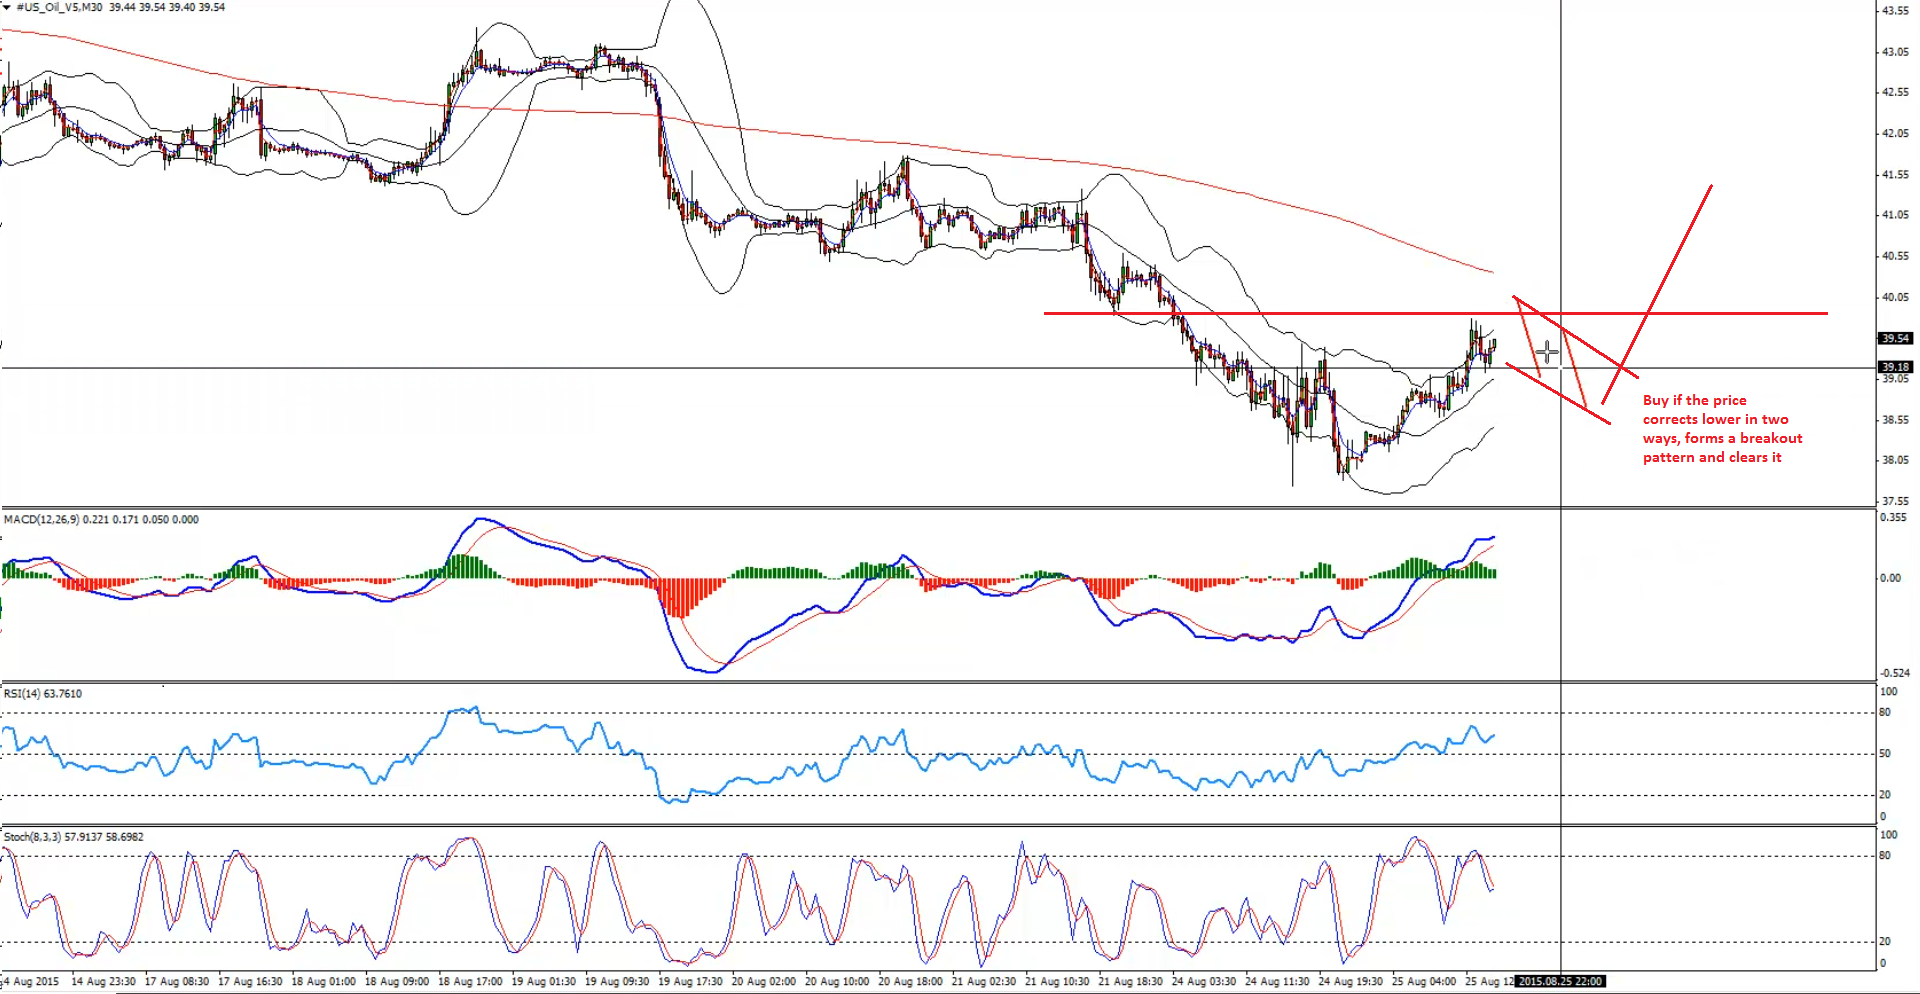
So, if OIL moves higher, completes the wave duplication pattern around $40.0, corrects lower in two waves, then we can look to enter a buy trade.
Technical Analysis
H1– Chart highlighting OIL clearing trend lines and resistance area.
Entry:
M30– We can enter a buy trade in OIL if it moves higher to complete wave duplication, corrects lower in two waves, forms a breakout pattern and breaks it towards the upside.
Target 1: $40.60
Target 2: $42.00
Stop Loss: Below the last low created
Video Explanation:
Yours,
Vladimir
Hi Traders! Arvinth here from the Home Trader Club team. The weekly summary and, review of July…
European markets edged lower on Thursday following more overnight volatility in Asia’s tech-dominated indexes, while…
Hi Traders! EURGBP short term forecast and technical analysis is here. We do our analysis…
Hi Traders! Bitcoin short term forecast update and follow up is here. On May 7th,…
Hi Traders! AUDJPY short term forecast and technical analysis is here. We do our analysis…
Hi Traders! Oil short term forecast and technical analysis is here. We do our analysis…