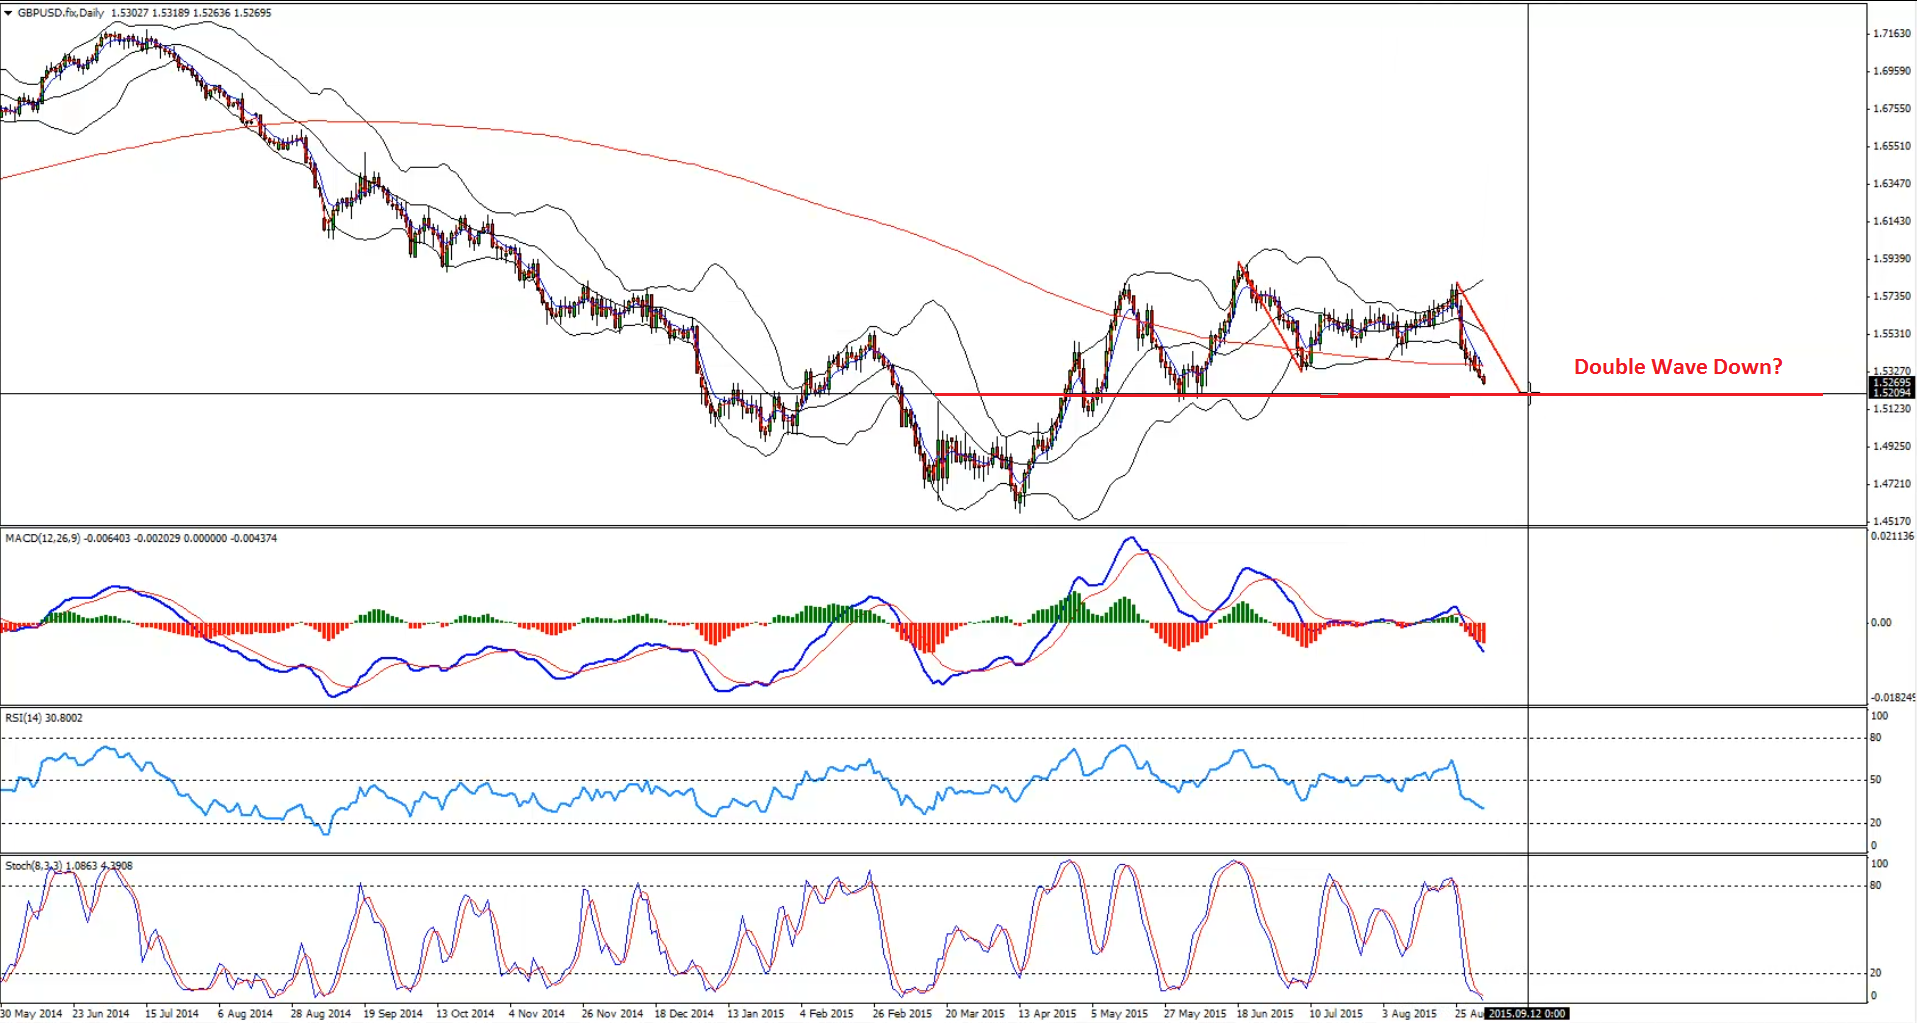
The British pound is moving lower currently against the US dollar, but I think it might be completing an interesting pattern. There is a chance of it forming a double wave down duplication pattern on the daily chart. There is a monster support around the 1.5200 area in the GBPUSD pair, which might produce a bounce in the near term if the pair trades near it.
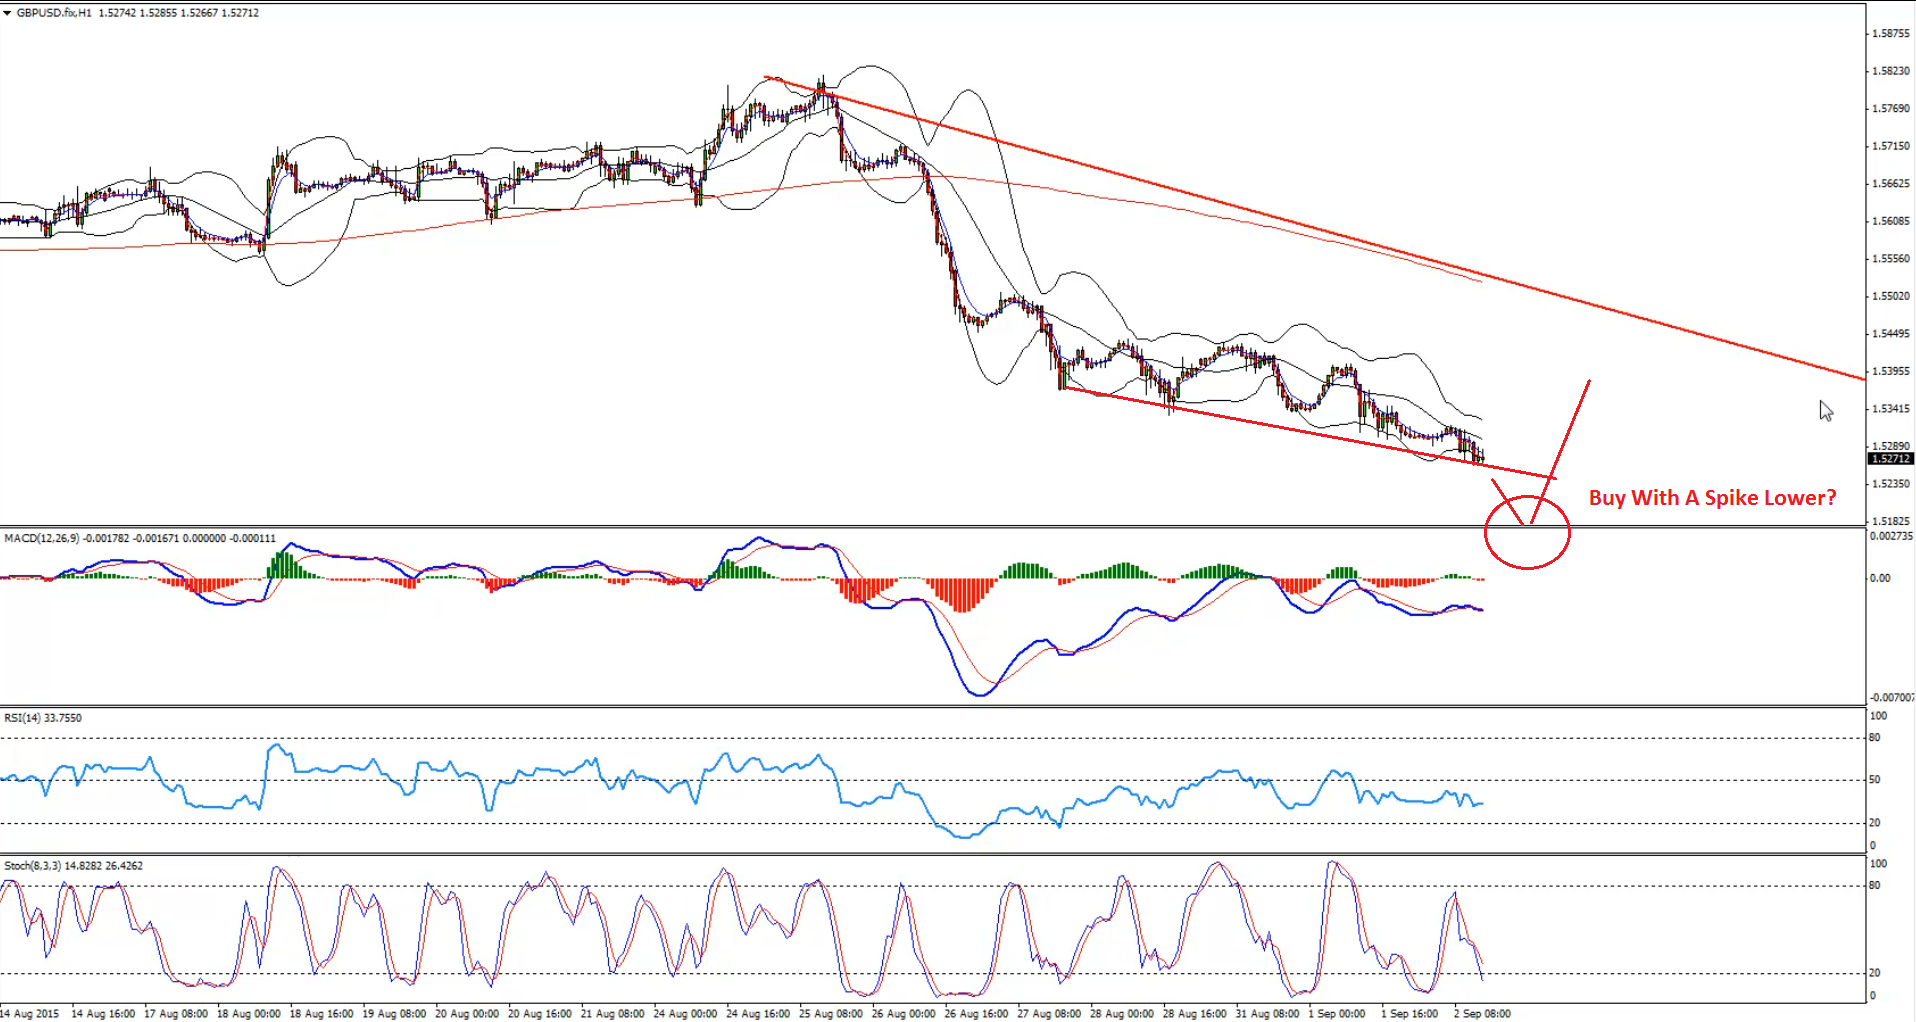
On the hourly chart, there is a support trend line, which can be breached for one final move down. Once the pair completes the downside reaction we might look to enter a buy trade.
Technical Analysis
D1– Chart highlighting the possibility a double wave duplication pattern for GBPUSD.
Entry:
H1– We can enter a buy trade in the GBPUSD pair if it spikes down, breaks the support trend line and forms a support near the 1.5200 area with a divergence.
Target 1: 1.5350
Target 2: 1.5460
Stop Loss: Below the last low created before entering into a trade
Video Explanation:
Hi Traders! Arvinth here from the Home Trader Club team. The weekly summary and, review of March…
Europe’s bonds will struggle to bounce back from a sharp selloff triggered by the war…
Hi Traders! GBPUSD short term forecast and technical analysis is here. We do our analysis…
Hi Traders! SP500 short term forecast update and follow up is here. On December 18th,…
Hi Traders! AUDNZD short term forecast and technical analysis is here. We do our analysis…
Hi Traders! USDJPY short term forecast update and follow up is here. On January 29th,…