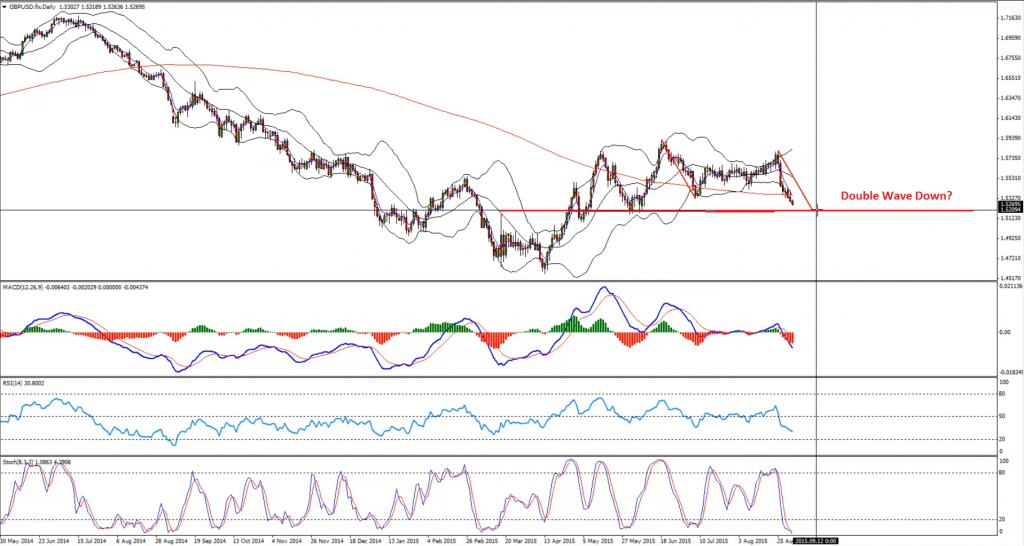
The British pound is moving lower currently against the US dollar, but I think it might be completing an interesting pattern. There is a chance of it forming a double wave down duplication pattern on the daily chart. There is a monster support around the 1.5200 area in the GBPUSD pair, which might produce a bounce in the near term if the pair trades near it.
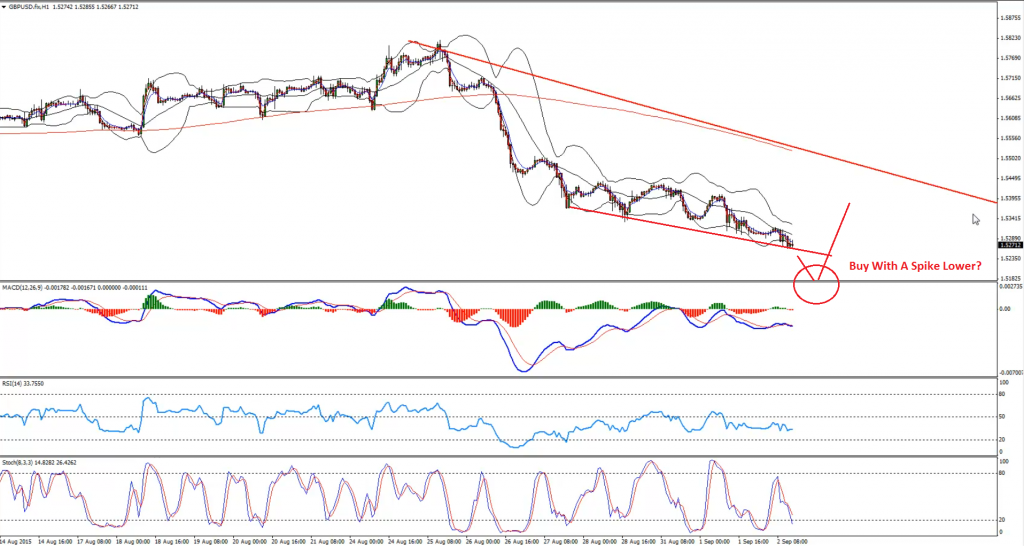
On the hourly chart, there is a support trend line, which can be breached for one final move down. Once the pair completes the downside reaction we might look to enter a buy trade.
Technical Analysis
D1– Chart highlighting the possibility a double wave duplication pattern for GBPUSD.
Entry:
H1– We can enter a buy trade in the GBPUSD pair if it spikes down, breaks the support trend line and forms a support near the 1.5200 area with a divergence.
Target 1: 1.5350
Target 2: 1.5460
Stop Loss: Below the last low created before entering into a trade
Video Explanation:


