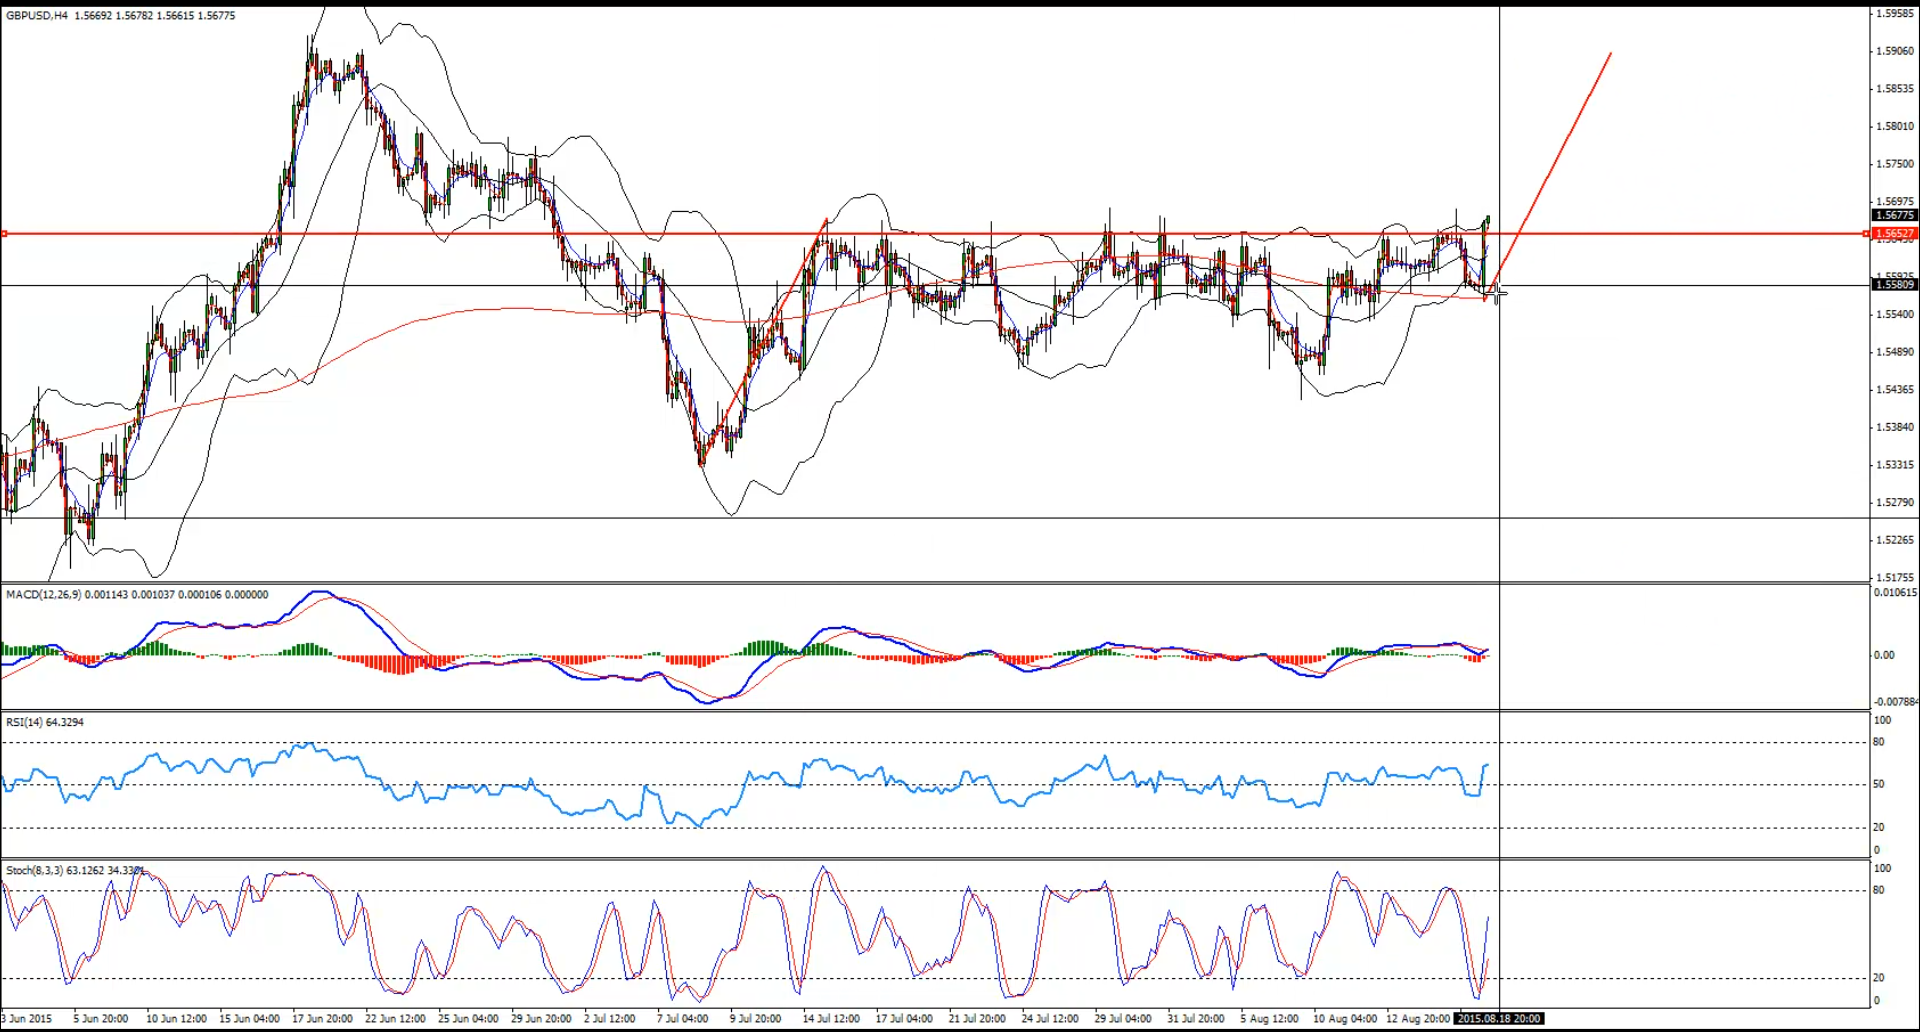
The British Pound enjoyed a decent run towards the upside today against the US dollar, as the UK Consumer Price Index released by the National Statistics posted a rise of 0.1% in July 2015, compared to the same month a year ago. The GBPUSD pair climbed higher and almost cleared a major resistance area around 1.5670-1.5700. So, I think it is a good signal for us to look for a buy opportunity in the short term.
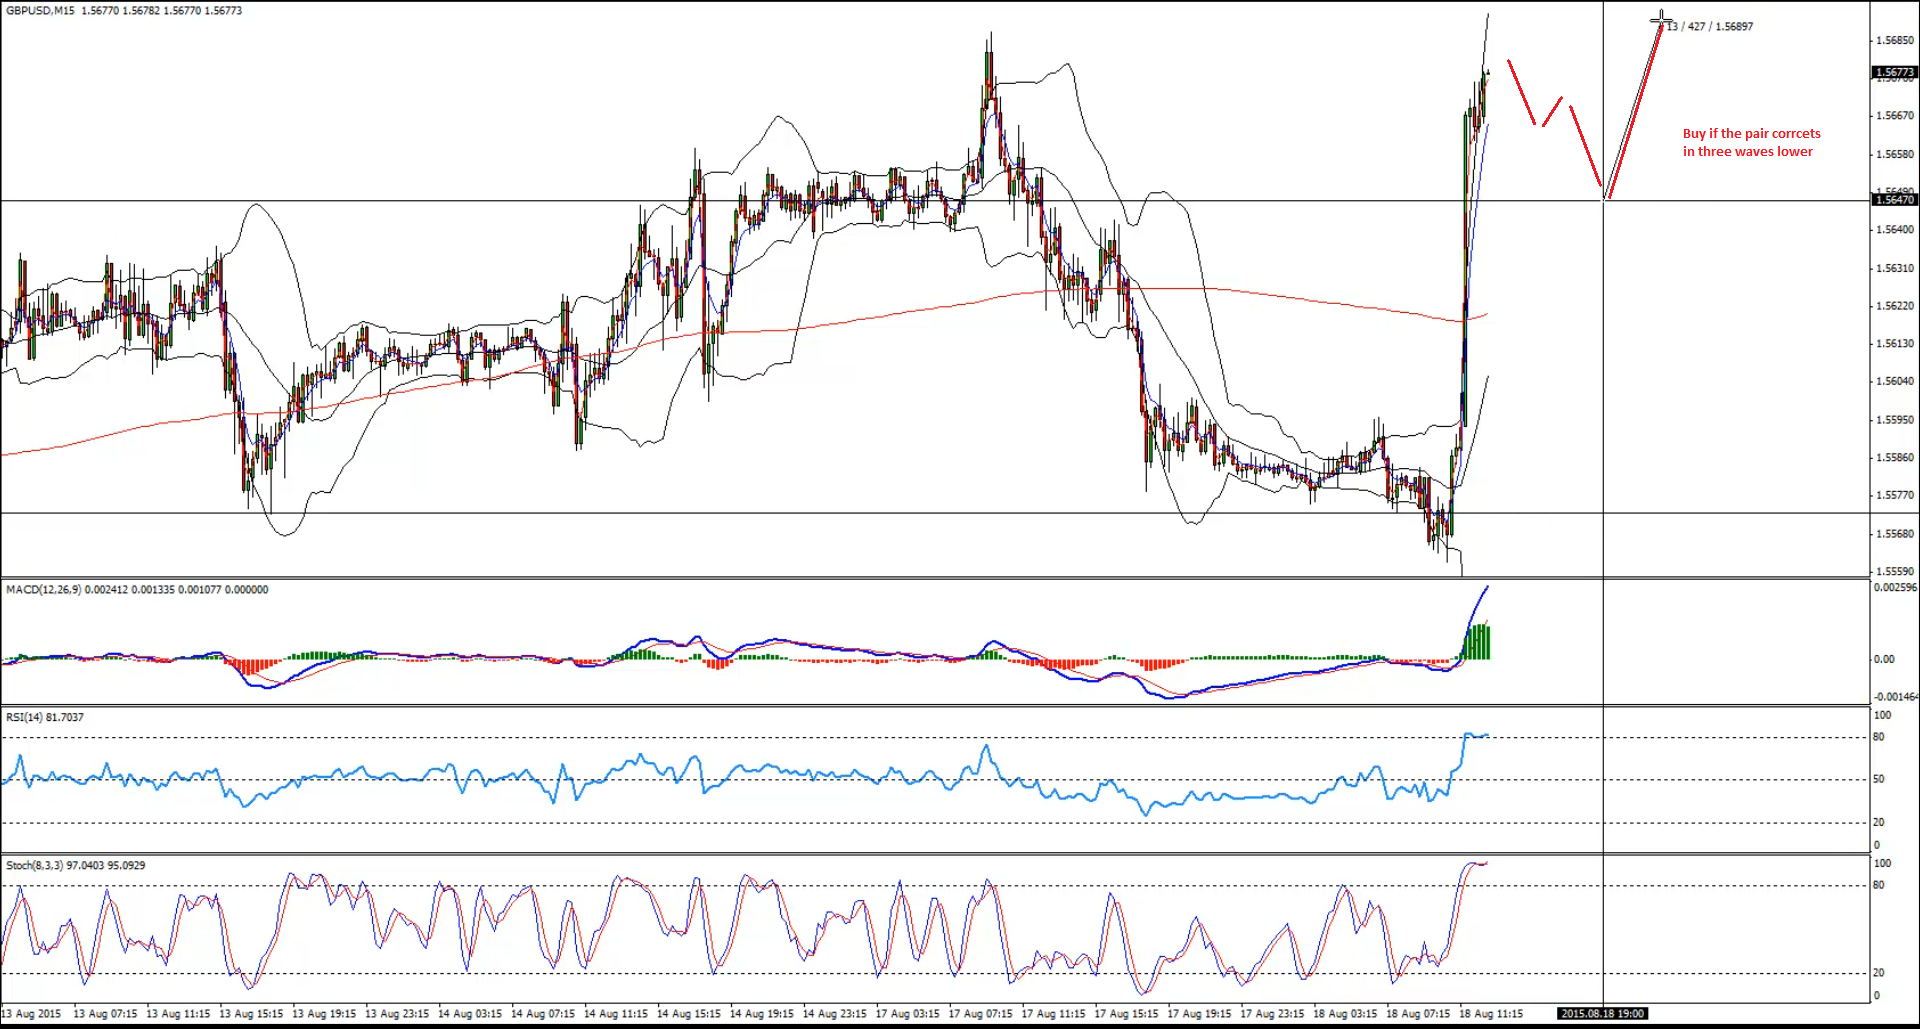
In order to enter a buy trade, we can look at the lower timeframes, and wait for a minor correction in three waves.
Technical Analysis
H4– Chart representing the GBPUSD breaking an important resistance area, and a wave duplication pattern.
Entry:
M15– We can wait for a minor correction in the GBPUSD pair in three waves down to enter a buy trade.
Target 1: 1.5800
Target 2: 1.5880
Stop Loss: Below the last low created before entering into a trade
Video Explanation:
Hi Traders! Arvinth here from the Home Trader Club team. The weekly summary and, review of March…
Europe’s bonds will struggle to bounce back from a sharp selloff triggered by the war…
Hi Traders! GBPUSD short term forecast and technical analysis is here. We do our analysis…
Hi Traders! SP500 short term forecast update and follow up is here. On December 18th,…
Hi Traders! AUDNZD short term forecast and technical analysis is here. We do our analysis…
Hi Traders! USDJPY short term forecast update and follow up is here. On January 29th,…