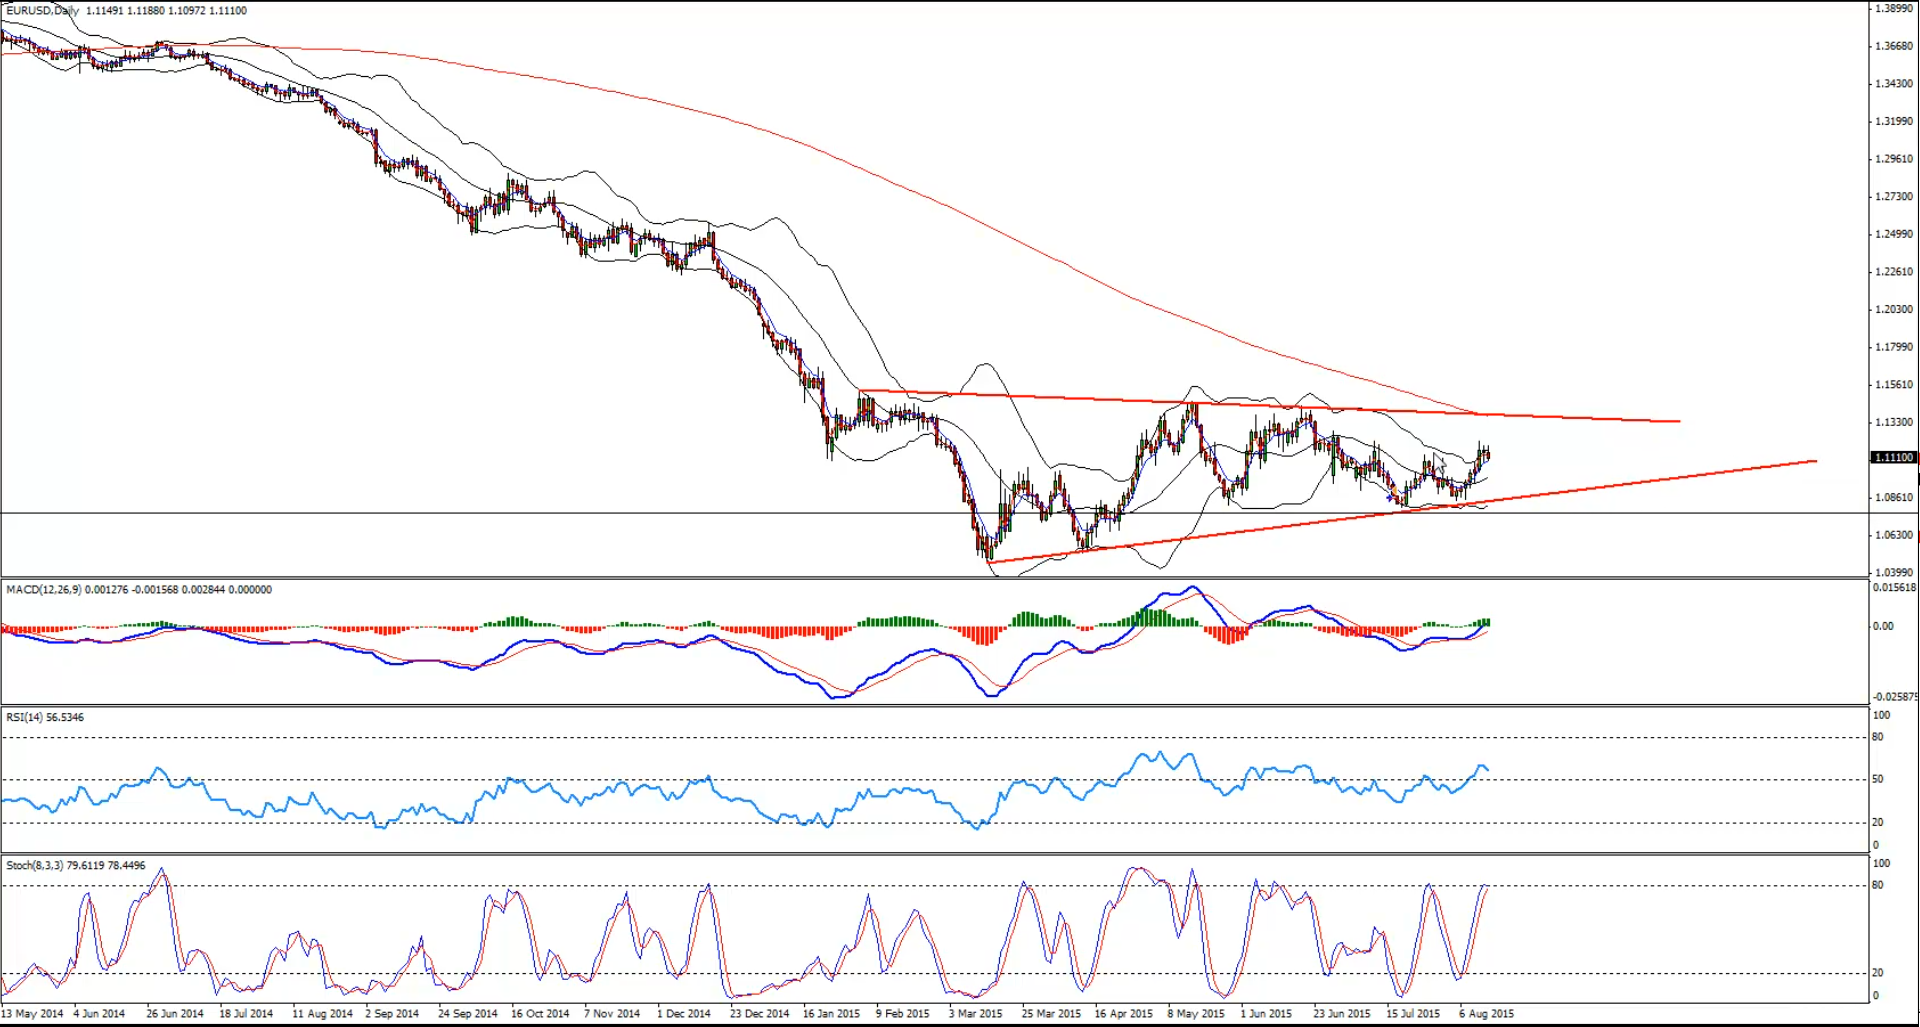
The Euro continued to trade in a range on the higher timeframe (daily) against the US Dollar. There is a triangle pattern forming on the daily chart of the EURUSD pair, and there is a chance that the pair might spike one more time higher to test the triangle resistance area. It also looks like a 5-waves structure and we could be in the 4th wave currently.
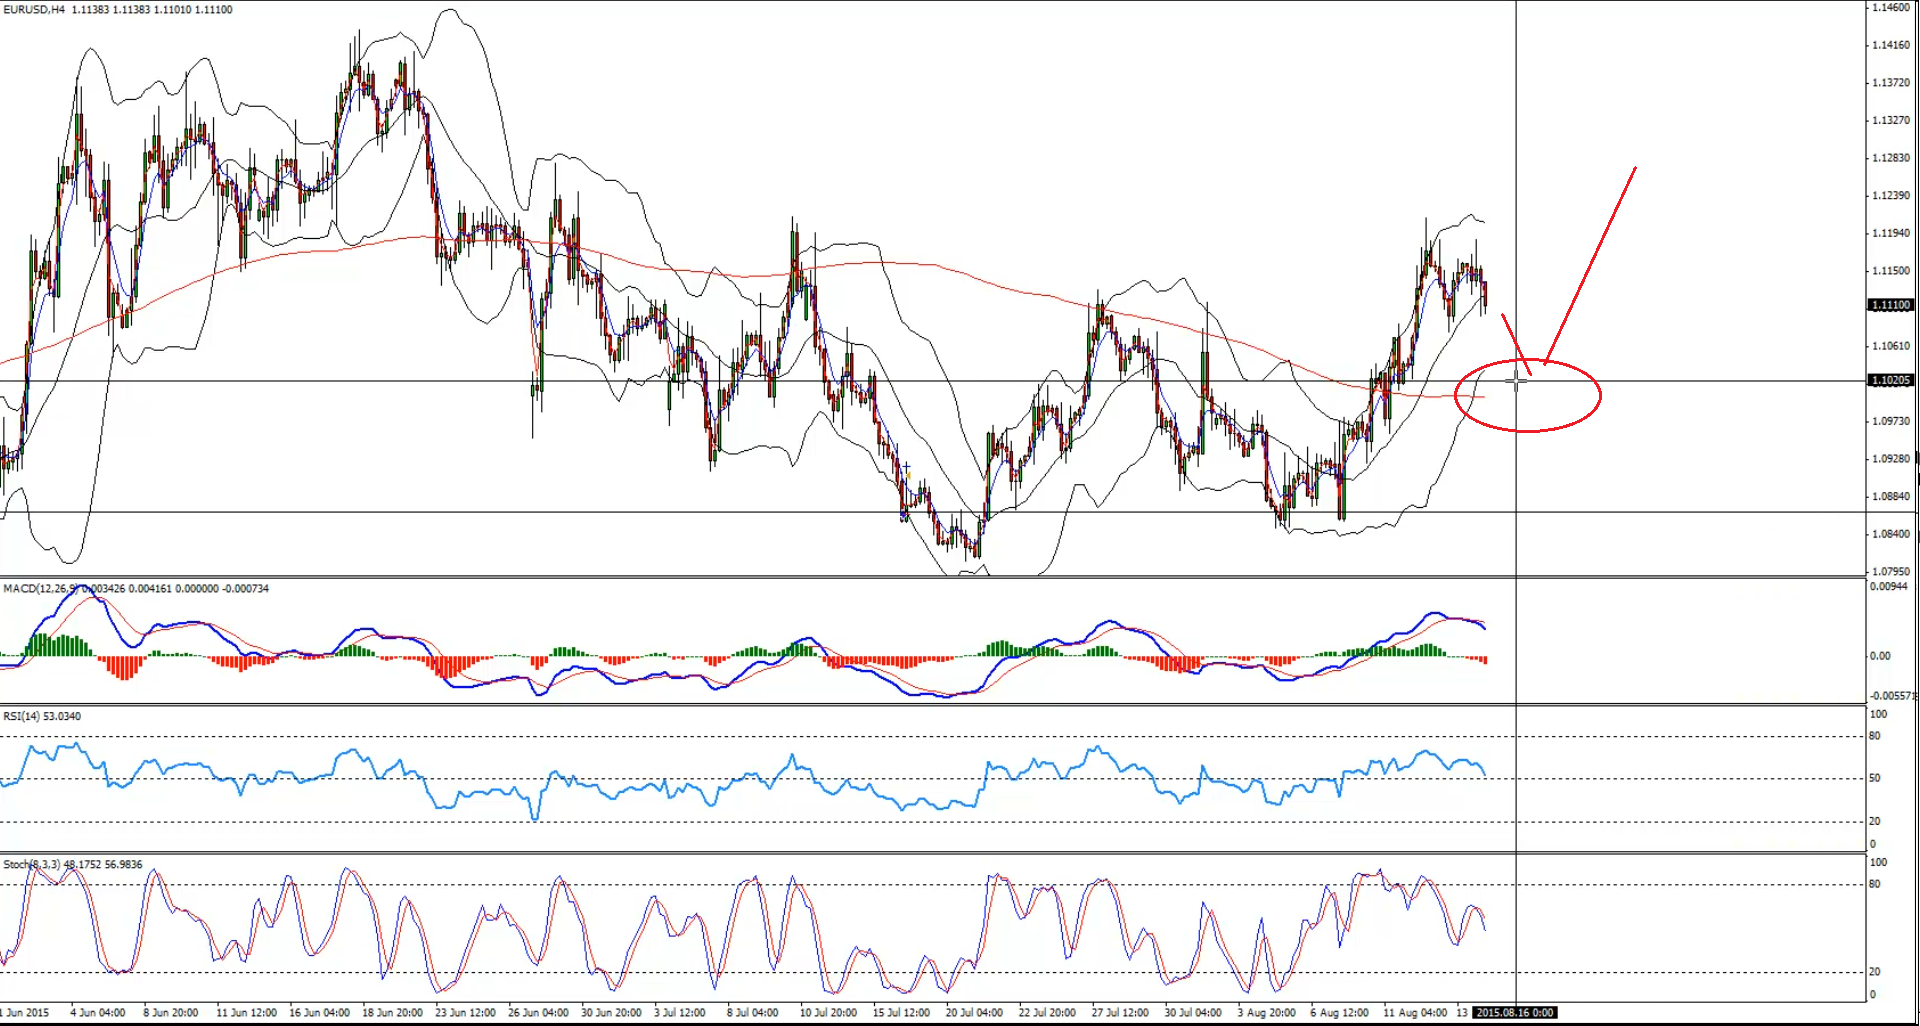
So, I think the best idea would be to wait for a small correction from the current levels towards the 100 moving average on the 4-hours chart to enter a buy trade.
Technical Analysis
D1– Chart representing the triangle pattern formed on the daily chart.
Entry:
H4– We can wait for a move down towards the highlighted support area near 1.1020-40 to enter a buy trade.
Target 1: 1.1180
Target 2: 1.1240
Stop Loss: Below the last low created before entering into a trade
Video Explanation:
GDP growth is one of the most important indicators of economic health. But does stronger…
When it comes to fundamental Forex analysis, few institutions matter as much as the Federal…
Interest rates are one of the most important fundamental forces in the Forex market. But…
The latest U.S. employment report has delivered a significant warning for the market. With only…
The Forex market does not always offer clear trading opportunities. Sometimes, price moves sharply in…
Open social media for a few minutes and you can easily find someone talking about…