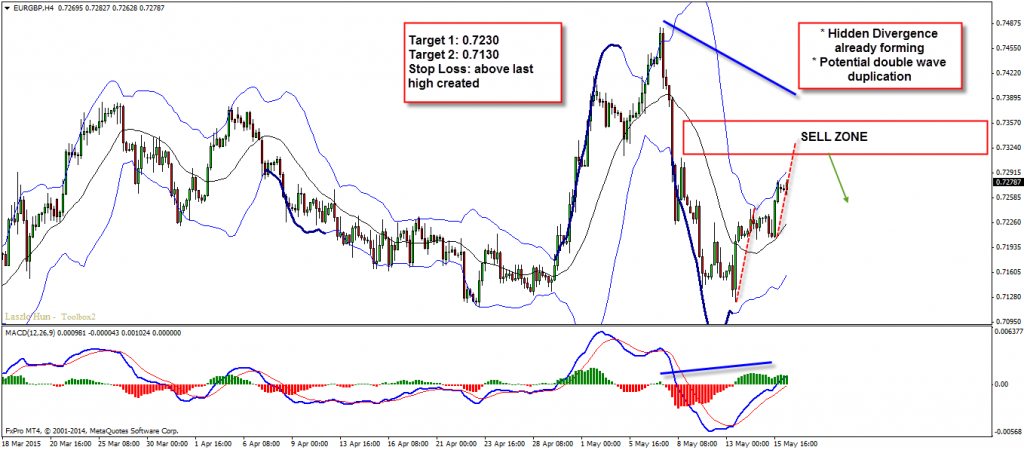
I’m looking for the potential double wave up to complete itself and make a stop. If so, look for sell opportunities. The levels to follow are 0.7330 – 0.7350. This zone also coincides with Fibonacci Retracement level 50% and 61.8% which is another good confirmation.
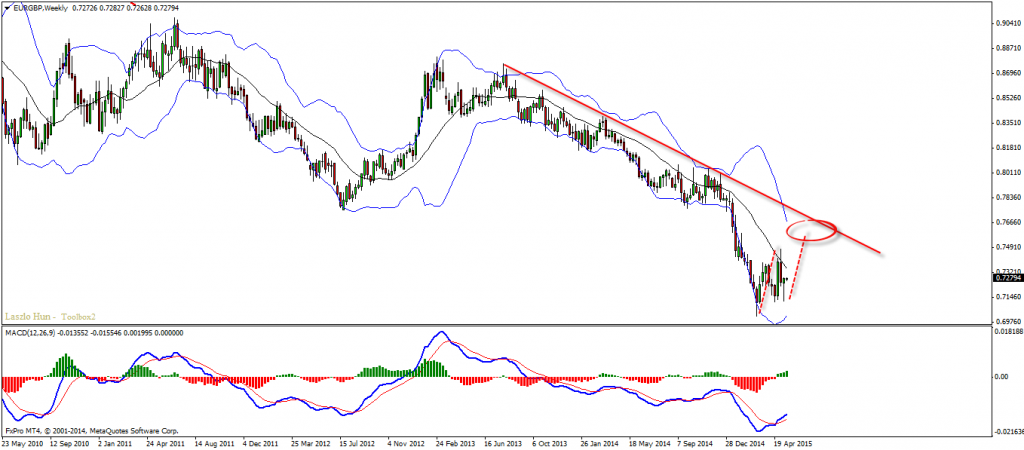
In case this support is broken up and the pair continues its rally, it is very likely the pair will push higher and go to the weekly down trend line near 0.78.
Technical Analysis Bearish Scenario:
H4 – hidden bearish divergence, potential double wave duplication
Technical Analysis Bullish Scenario:
W1 – if the zone discussed above is broken i suspect that the pair will push higher
Entry:
H4 – Wait for double wave duplication up near the 0.7330 – 0.7350 zone and then look for a sell.
Target 1: 0.7230
Target 2: 0.7130
Stop Loss: above last high created
Video Explanation:
Yours,
Vladimir
Hi Traders! Litecoin short term forecast and technical analysis is here. We do our analysis…
Hi Traders! Dow Jones short term forecast and technical analysis is here. We do our…
The new trading week begins after an extremely volatile period across global markets. Geopolitical tensions…
Hi Traders! Arvinth here from the Home Trader Club team. The weekly summary and, review of March…
Oil prices rose more than 2% on Thursday, extending a rally as the escalating U.S.-Israeli war…
Hi Traders! GBPUSD short term forecast and technical analysis is here. We do our analysis…