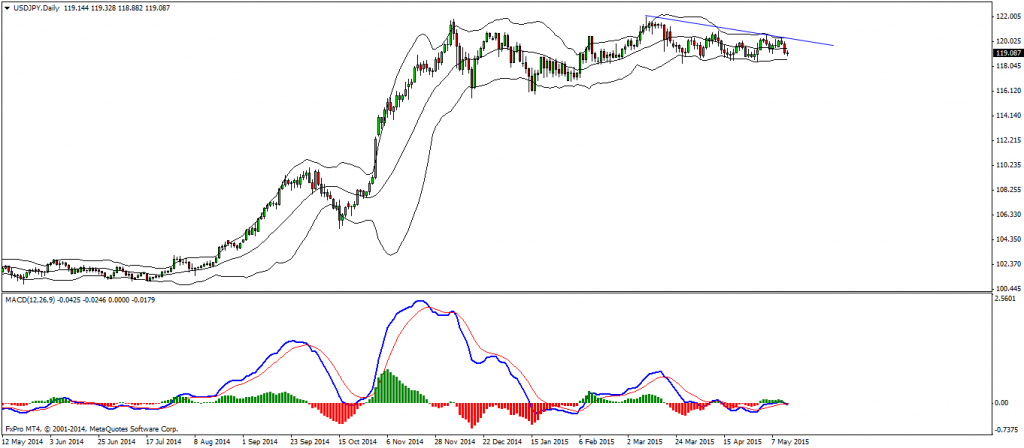
Even though this pair is inside a range on the daily chart we can still enjoy from it on the lower time frames. Looking at the daily chart closely, we can see that the down trend line is well respected and the pair is still making lower highs. So if we get double wave correction to the upside near 119.50 – 120.00 zone we can look for sell opportunities.
Technical Analysis:
D1 – bearish trend line
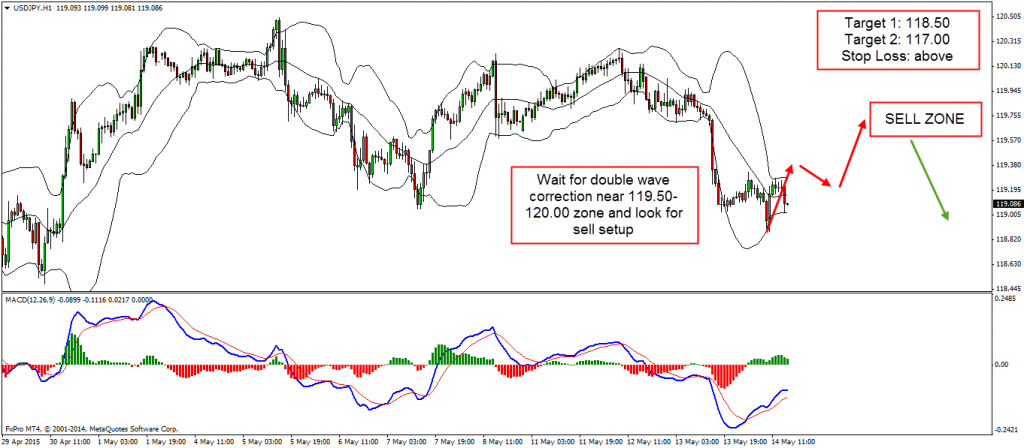
H1 – look for double wave correction up near the daily down trend line. Levels to follow are 119.50 up to 120.00 zone. Ideally we will also get hidden bearish divergence.
Target 1: 118.50
Target 2: 117.00
Stop Loss: above 120.30
Video Explanation:
Yours,
Vladimir
The financial markets are entering another potentially volatile trading week, with geopolitical developments likely to…
Hi Traders! Arvinth here from the Home Trader Club team. The weekly summary and, review of July…
U.S. stock indexes hit multi-week lows on Thursday, as concerns over heavy AI spending resurfaced…
Hi Traders! GBPUSD short term forecast and technical analysis is here. We do our analysis…
Hi Traders! Ethereum short term forecast follow-up and update is here. On May 26th, 2026…
Hi Traders! GBPAUD short term forecast and technical analysis is here. We do our analysis…