Pair is reaching weekly low and support zone. On the Daily chart we can see that there is Bollinger Band duplication and half more is due. The four hour chart is about to duplicate the previous down wave around the weekly high and support zone. One more confirmation comes from the bullish divergence which is already present. All that together creates a high probability buy opportunity that we should follow closely and pull the trigger at the right time. So here is my plan on how exactly to enter.
Technical Overview:
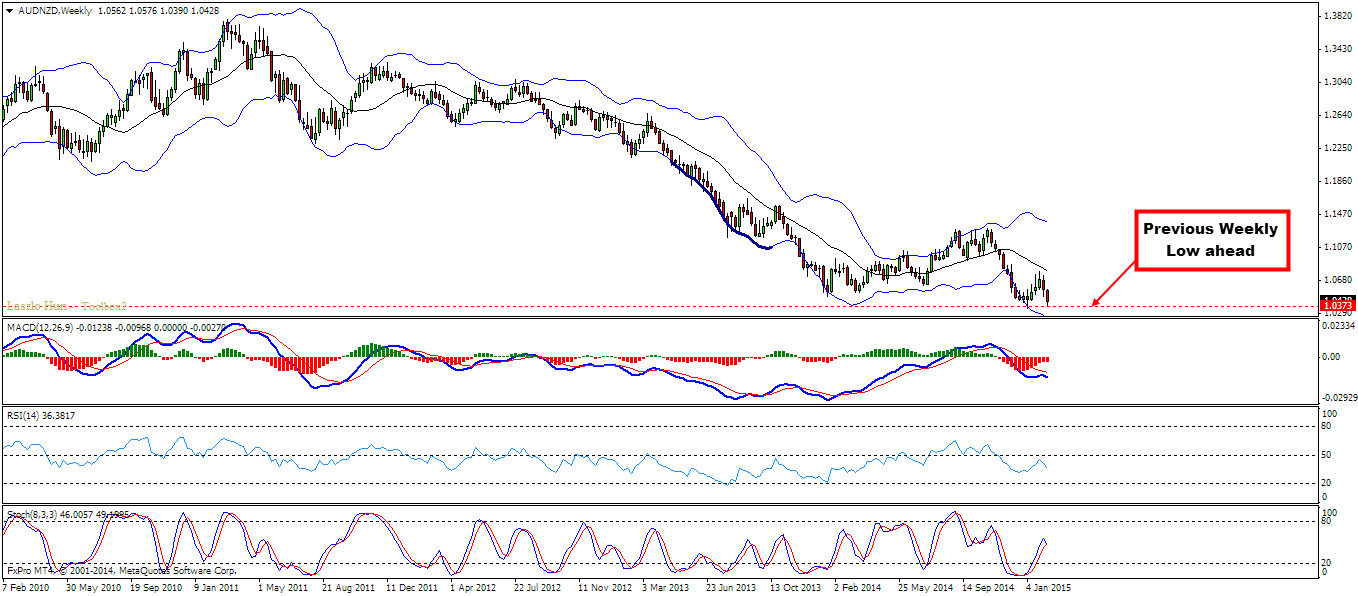
W1: Previous low ahead
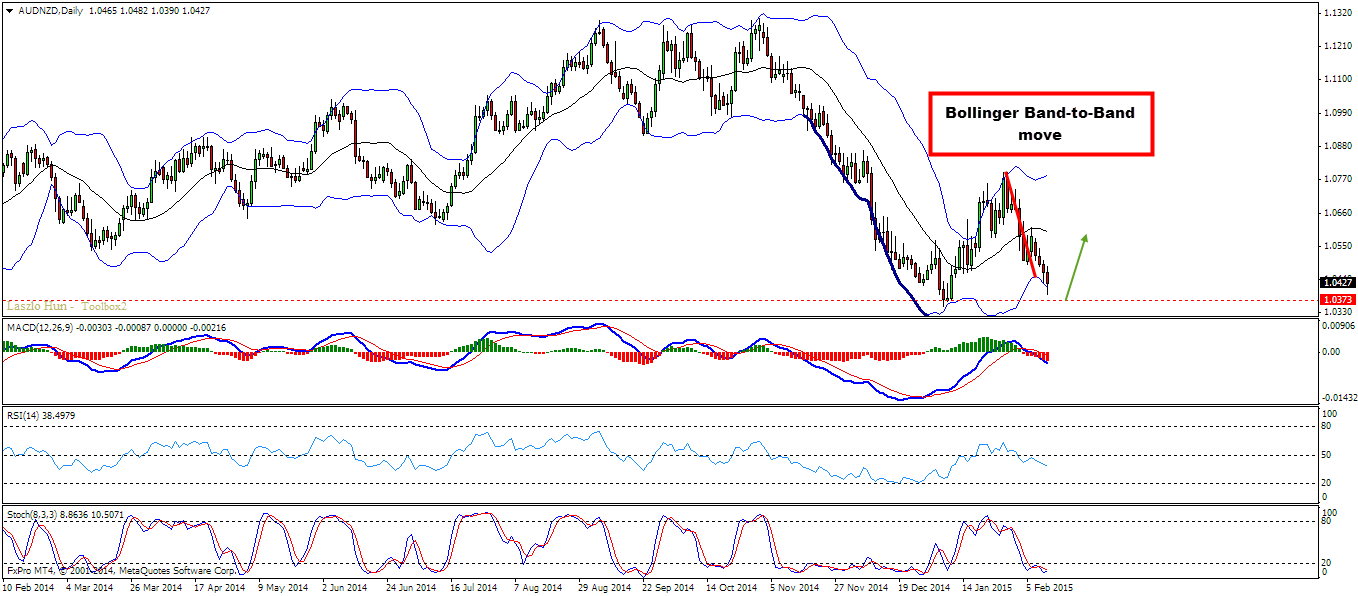
D1: Bollinger Band to Band move, we can expect half more. support ahead around 1.0375
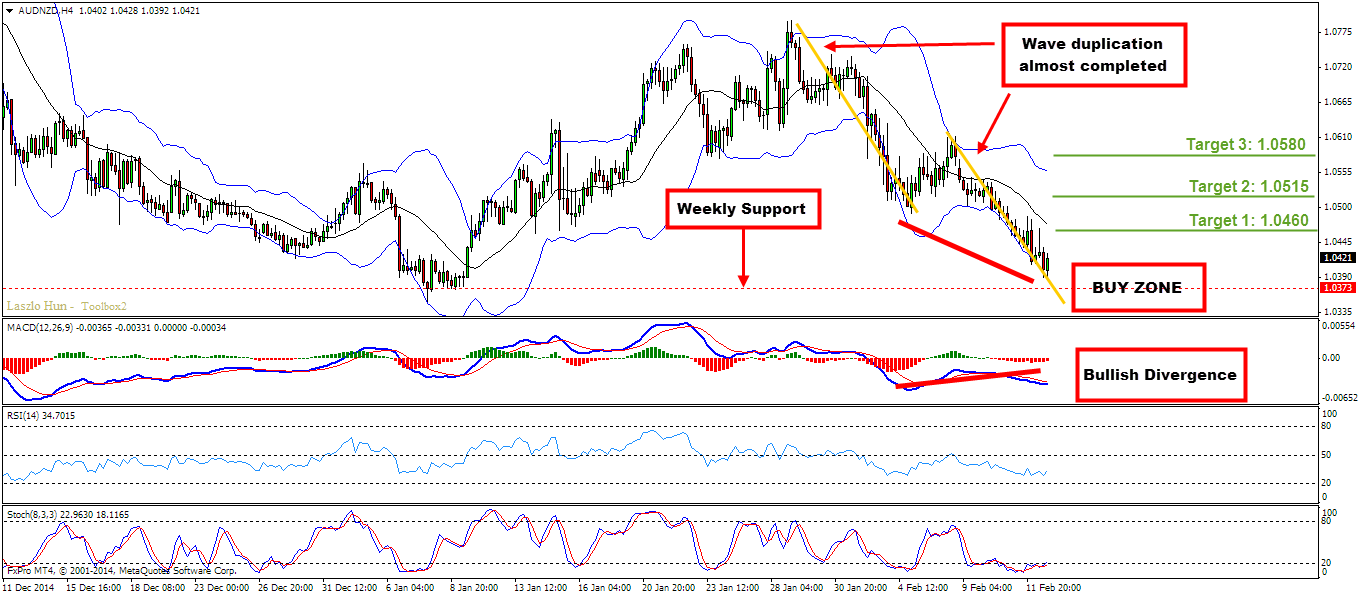
H4: Bullish divergence, potential wave duplication
Entry:
H4/H1: Look for bullish candle pattern near the support on the H4 chart or alternatively drop to the H1 chart and follow the last down trend line created. Once the trend line and the most recent resistance are broken you can jump into a buy trade.
Target 1: 1.0460
Target 2: 1.0515
Target 3: 1.0580
Stop Loss: below 1.0350
Video Explanation:
Yours,
Vladimir
Hi Traders! USDJPY short term forecast update and follow up is here. On January 29th,…
Hi Traders! AUDCHF short term forecast and technical analysis is here. We do our analysis…
World markets rapidly reversed course on Monday after U.S. President Donald Trump said he will…
Hi Traders! Arvinth here from the Home Trader Club team. The weekly summary and, review of March…
Gold sank for a seventh session as the escalating war in the Middle East drove oil…
Hi Traders! EURGBP short term forecast and technical analysis is here. We do our analysis…