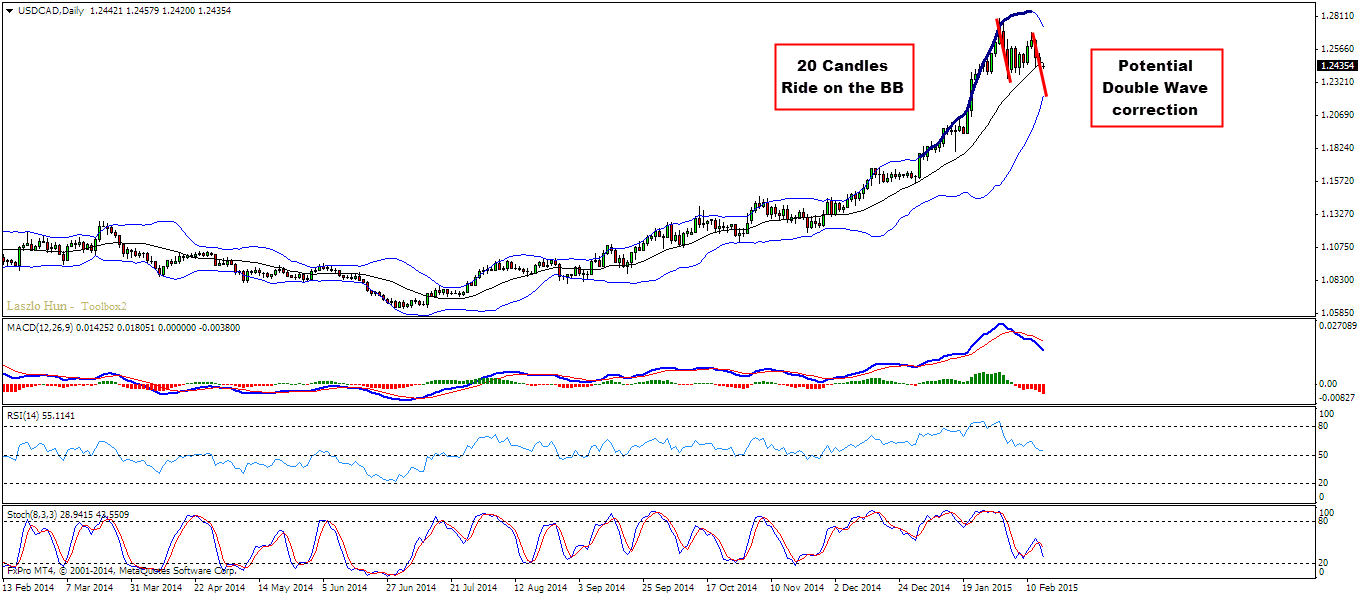
We’ve been watching the USDCAD since last week. I think we should see double wave correction on the daily chart before any potential continuation up. The way to join is with the break of the up trend line or neck line – the pattern formed reminds head & shoulders.
Technical Overview:
D1: 20+ candles ride on the bollinger bands, potential double wave correction
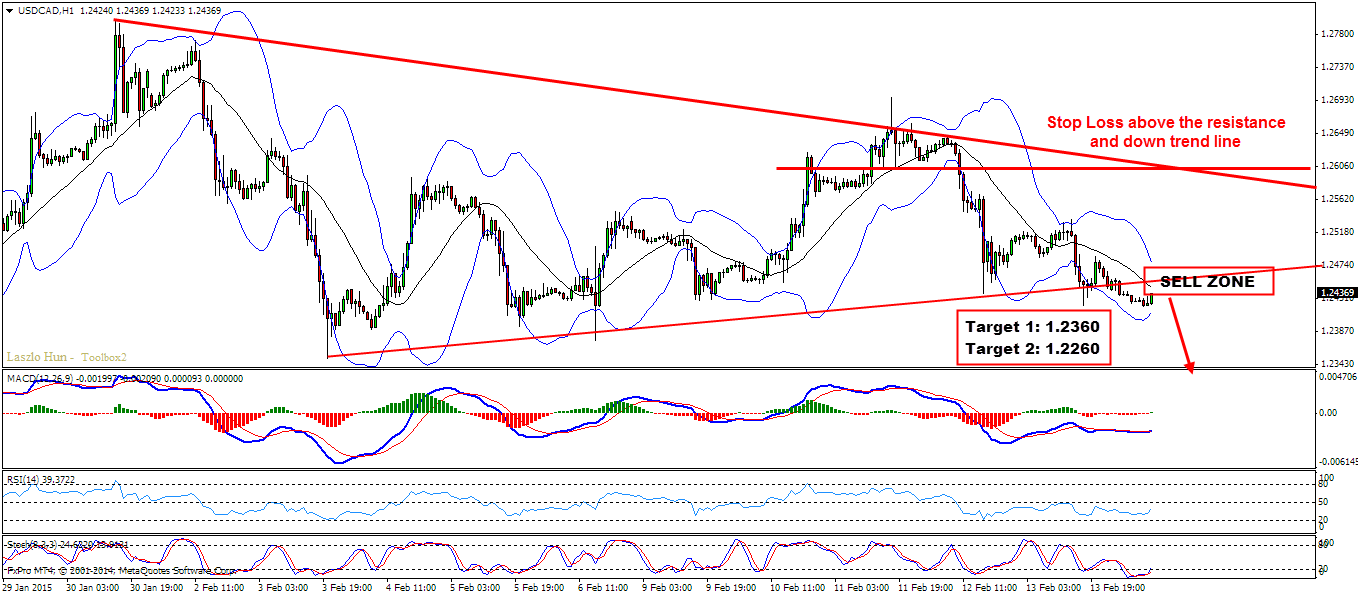
H1: Head & Shoulders, up trend line/neck line
Entry:
H1: The price pushed down near the last low on the H1 chart so now we should be looking for double wave correction on the M15 chart and sell around the trend line.
Target 1: 1.2360
Target 2: 1.2260 – watch for the Daily Opposite Bollinger Band, you may want to close your position if it is reached before 1.2260
Stop Loss: above the down trend line on H1
Yours,
Vladimir
Hi Traders! Arvinth here from the Home Trader Club team. The weekly summary and, review of July…
U.S. stock indexes hit multi-week lows on Thursday, as concerns over heavy AI spending resurfaced…
Hi Traders! GBPUSD short term forecast and technical analysis is here. We do our analysis…
Hi Traders! Ethereum short term forecast follow-up and update is here. On May 26th, 2026…
Hi Traders! GBPAUD short term forecast and technical analysis is here. We do our analysis…
Hi Traders! USDCHF short term forecast update and follow up is here. On May 20th,…