Hi Traders! AUDJPY short term forecast update and follow up is here. On June 29th 2023 I shared this “AUDJPY Short Term Forecast And Technical Analysis” post in our blog. In this post, let’s do a recap of this setup and see how it has developed now. If you would like to learn more about the way we trade and the technical analysis we use then check out the Home Trader Club. Spoiler alert – free memberships are available!
My Idea
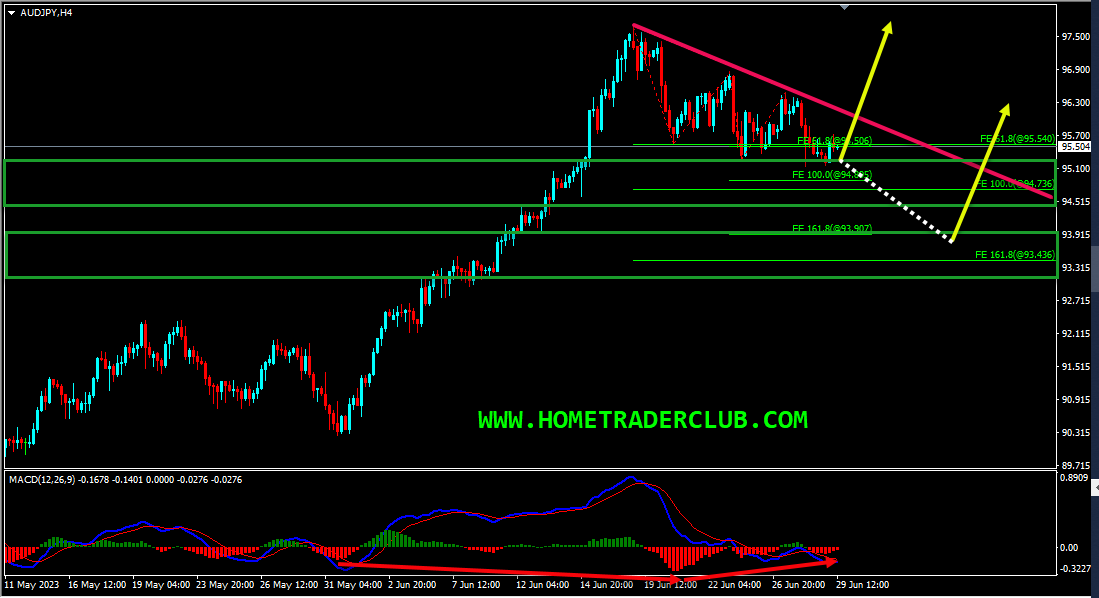
On the H4 chart, currently it looks like a correction is happening and while measuring the legs, we have two key support zones that has formed. The first key support zone is formed based on the 100%(94.736) Fibonacci expansion level of the big wave and the 100%(94.895) Fibonacci expansion level of the small wave. The second key support zone is formed based on the 161.8%(93.436) Fibonacci expansion level of the big wave the 161.8%(93.907) Fibonacci expansion level of the small wave. The price which was moving lower, has currently reached the first key support zone. Also, we could see that the price which was moving lower has created a bullish hidden divergence that has formed between the first low at 90.258 and the second low at 95.564 followed by a potential bullish divergence that is forming based on the MACD indicator which we may consider as another evidence of bullish pressure. So based on all this, until the key support zones hold my short term view remains bullish here. A valid breakout above the most recent downtrend line would be the validation for this bullish view.
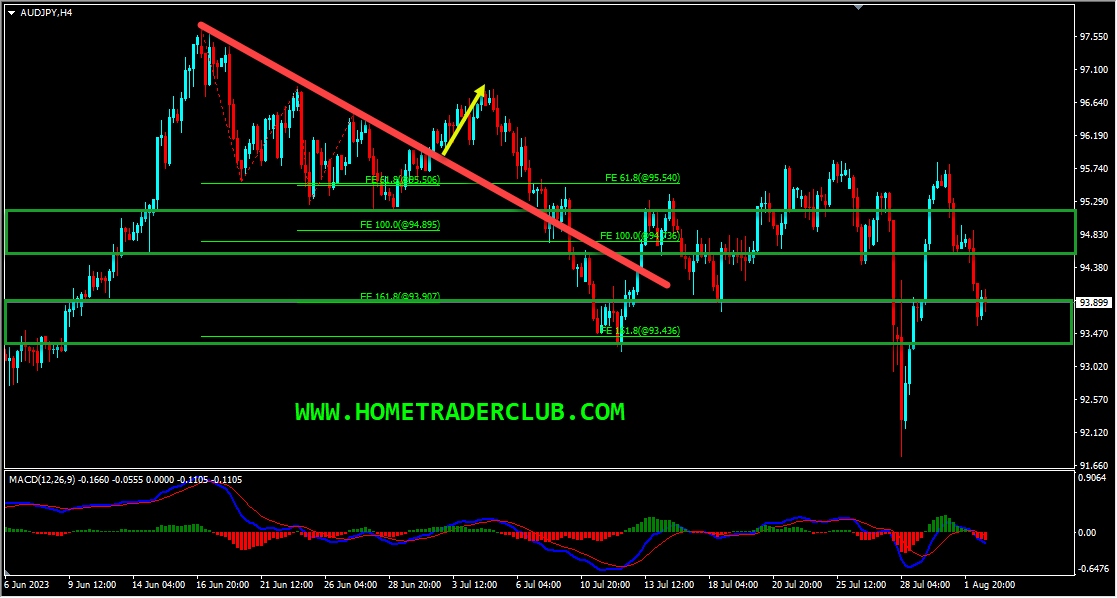
Based on the above-mentioned analysis my short term view was bullish here and I was expecting the price to move higher further until the two key support zones hold. Also, I mentioned that “If we get a valid breakout above the most recent downtrend line we may then consider it as a validation for this bullish view”. The price action didn’t follow my analysis here, the validation for the bullish view which is a valid breakout above the most recent downtrend line happened and then price moved higher and delivered around 100 pips move. The price then moved lower and broke below both the key support zones, thus invalidating the bullish view. My current view on this pair is neutral.
So traders, this is why I wanted to show this example to help you understand why we should always trade based on the facts and hints provided by the market and take the right actions according to that. Even though we had various facts supporting the bullish view, the price didn’t hold in the two key support zones as I expected it to and broke below them, which is a contradictory sign provided by the market opposing the bullish view. Also, you should keep in mind that losses are part of trading we can’t expect every trade to go as per our plan and provide us profits. In trading, we can’t avoid losses but in order to be successful in trading, we should know how to cut losses early and how to manage the trade when the price goes in the opposite direction.
Note: You can watch the webinar on how to cut losses early here
Not sure how to enter a trade? Spot reversals (bounces)? Not sure how to spot breakouts?
I invite you to
And improve your trading with us.
Also, you can get one of our strategies free of charge. You will find all the details here
If you have any further questions, don’t hesitate to drop a comment below!
Happy Trading!
Arvinth Akash
Home Trader Club Team
Welcome to this week’s Forex forecast. In this analysis, we break down the key technical…
Hi Traders! Arvinth here from the Home Trader Club team. The weekly summary and, review of April…
Stocks and bonds fell as oil surged anew, with President Donald Trump dashing optimism that the war in…
Hi Traders! GBPCAD short term forecast and technical analysis is here. We do our analysis…
Hi Traders! AUDJPY short term forecast and technical analysis is here. We do our analysis…
Hi Traders! EURJPY short term forecast update and follow up is here. On February 3rd,…