


Hi Traders!
In this article, I will break down “Hidden Divergence,” one of the hottest day trading subjects revolving real trend trading.
In this article, I will briefly explain what are hidden divergences and some of their core principles.
Additionally, we will cover one of the trading strategies I employ while trading with hidden divergence trading techniques.
So let’s begin.
Hidden Divergence
Hidden Divergence can be a trend continuing divergence.
Meaning, once spotted, it may act as a confirmation that trend continues to occur – if this is accurate this means that day traders can net profits from trend continuing investments.
An example, spotting a hidden divergence during a bearish trend may suggest to a day trader that it is likely that a continuation of a bearish trend is likely to occur.
The same could be said in regards to hidden divergence patterns that emerge in bullish trends.
An educated source within the day trading arena reveals a couple of tendencies that are likely to occur with the trend of continuing hidden divergence techniques.
Hidden Bullish Divergence Trait
This occurs when the price is making a higher low (HL) but the oscillator is showing a lower low (LL).
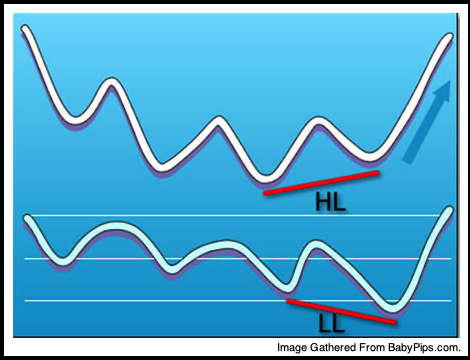
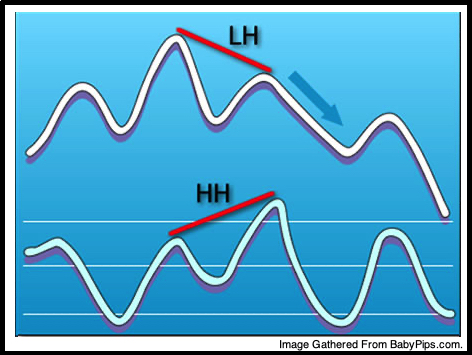
Hidden Bearish Divergence Trait
This occurs when the price is making a lower high (LH) WHILE the oscillator is making a higher high (HH).
Using technical oscillating indicators and indicators is useful to spot hidden divergences, however, I prefer the histogram of the MACD, thus the examples provided here are based on MACD.
What Do Hidden Divergences Tell Us?
Answer: A possible continuation of the ongoing trend may occur.
How to Identify a Hidden Divergence [Visual]
Let’s look at some charts.
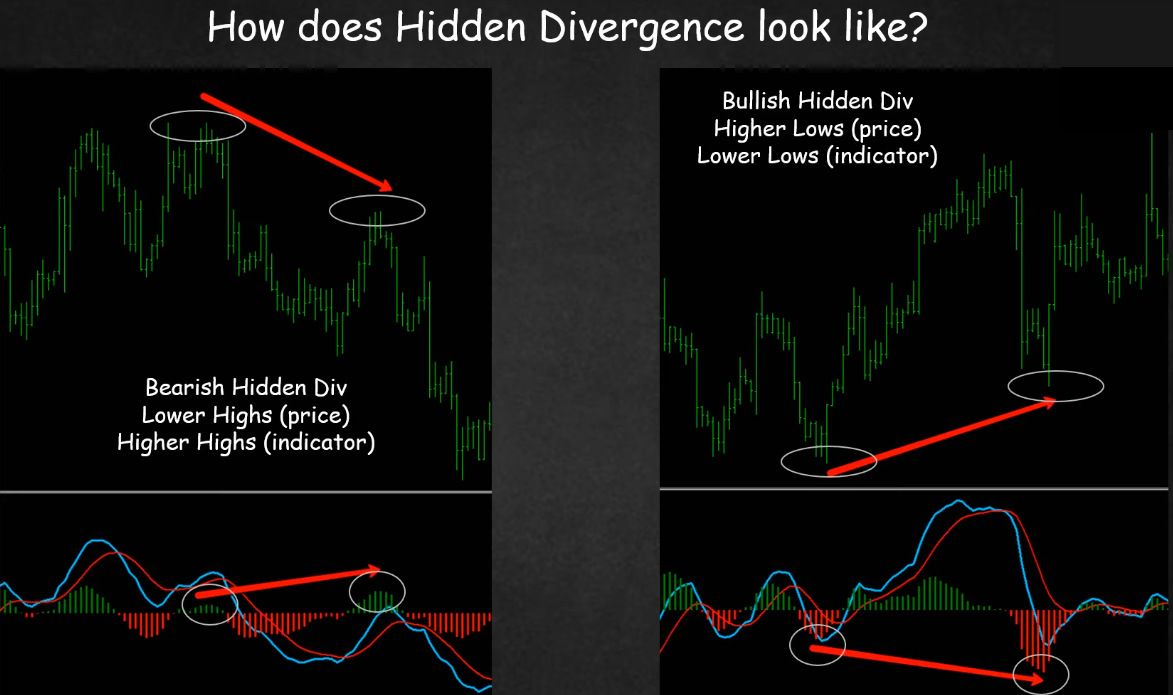
Above this text is an example of a Bearish Hidden Divergence.
By using the definition of a bearish trend (a bearish trend characterized by the highs are going down) we can confirm the existence of a hidden divergence.
Normally when we have lower highs on the chart and while looking at the histogram of the MACD it will show exactly the opposite (that is higher highs).
Whereas in a Bullish Hidden Divergence, we spot the bullish trend (a bullish trend where the lows are going higher) such as the one in the above example.
Notice that the second high is higher than the first higher (while at the same time checking the MACD histogram) where you see exactly opposite signs verifying that the second low would be lower than the first low.
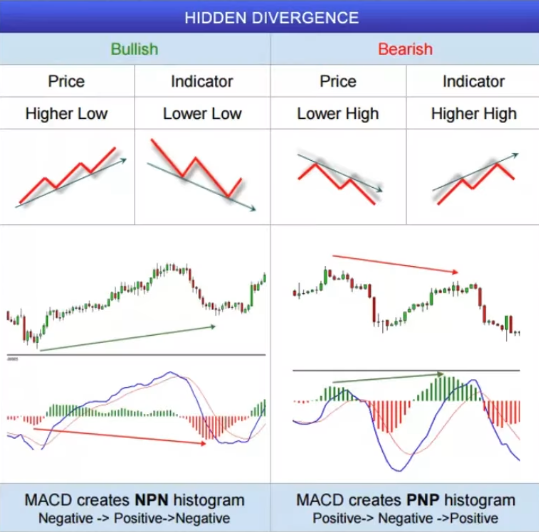
To remember this easier I have prepared the ideogram below for you:
Hidden Divergence – [What Not To Do]
The most common mistake that inexperienced traders make would be mistaking false hidden divergence scenarios as a green light to get started with day trading.
This is common among very excited online investors who are new to online day trading.
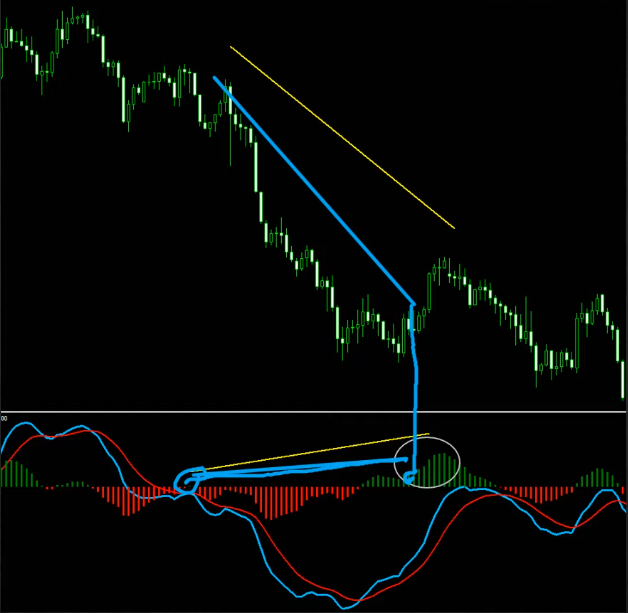
For instance, in the chart below, looking at the downtrend you will spot that a hidden divergence starts much earlier than the official top (marked in blue arrow).
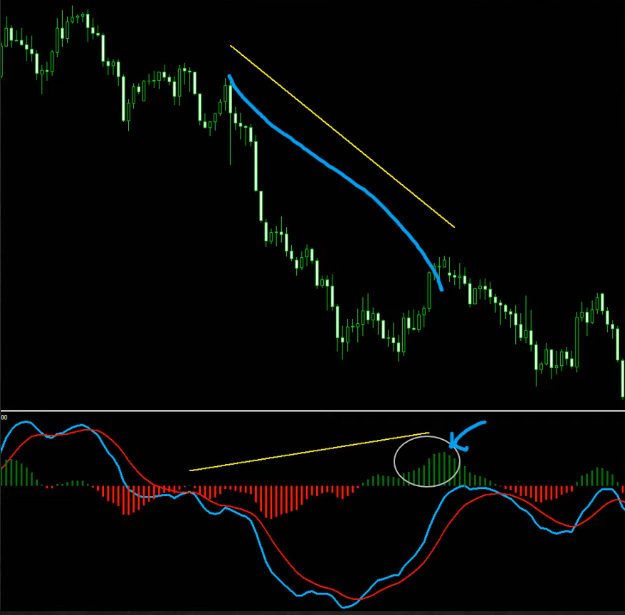
If you take a look at the area shown in the screenshot below and draw a line, you could see that the MACD is already higher than the previous high on the MACD and we do have lower highs at that point.
So we have lower highs on the chart and higher highs on the MACD histogram at this point.
But this is not good enough for us to celebrate this hidden divergence because the divergence becomes official mainly when it ticks or at least has to be confirmed in a lower timeframe (I’ll expand upon this soon).
Bottom Line: Don’t be super excited when you see something that reminds you of a hidden divergence and believes that the trend is going to continue.
There are two main factors when it comes to hidden divergence which is perfect trading and classical correct professional trading with Hidden Divergence.
Hidden Divergence Trading Strategy
One of the main trading strategies that I would apply when there is a hidden divergence is as follows:
1. Identify Hidden Divergence
2. Make sure that there are no signs against you on the higher timeframe (this is because the hidden divergence is a trend continuation divergence) which means if you want your trend to keep developing then the higher timeframes better support us and should not have signs against us (that is to give a free road for the trend).
3. Make sure the lower timeframe is supporting the Hidden Divergence with regular/basic divergence. (This is because hidden divergence comes after a trend and then we get a correction, at the end of this correction we predict the trend to continue). As a result, this correction is a corrective cycle that is a short term trend against the main trend and as it is going against we want this short term trend to end (trends generally end with the basic type of divergences).
Important – If #2 or #3 are missing, we skip the setup.
Note: I feel that if you want to learn more in-depth insights about divergences, you can benefit greatly from the videos on my channel here while also embarking upon Divergence University for comprehensive divergence education.
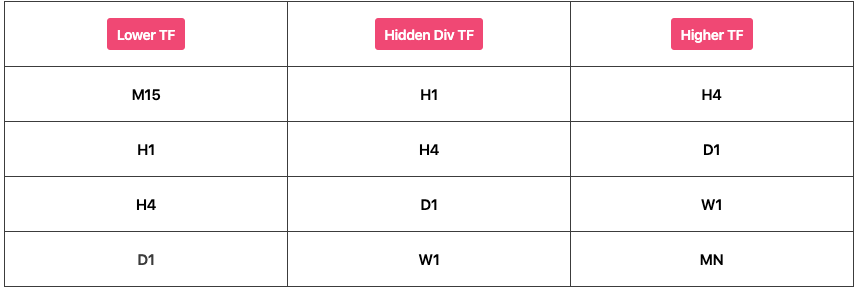
In the table below I have mentioned the higher timeframe (to check for no opposite signs) and lower timeframe (to look for confirmation in the form of regular divergence) when we identify a hidden divergence.
Example
We spot a hidden divergence on our H1 chart then the lower timeframe to look for confirmation would be the M15 chart and the higher timeframe to look for no opposite signs to make sure ‘the roads are free’ for the trend would be the H4.
Similarly, you can check this table for other timeframes, remember it will help you when you work with hidden divergence.
Now let’s look for an example in the chart:
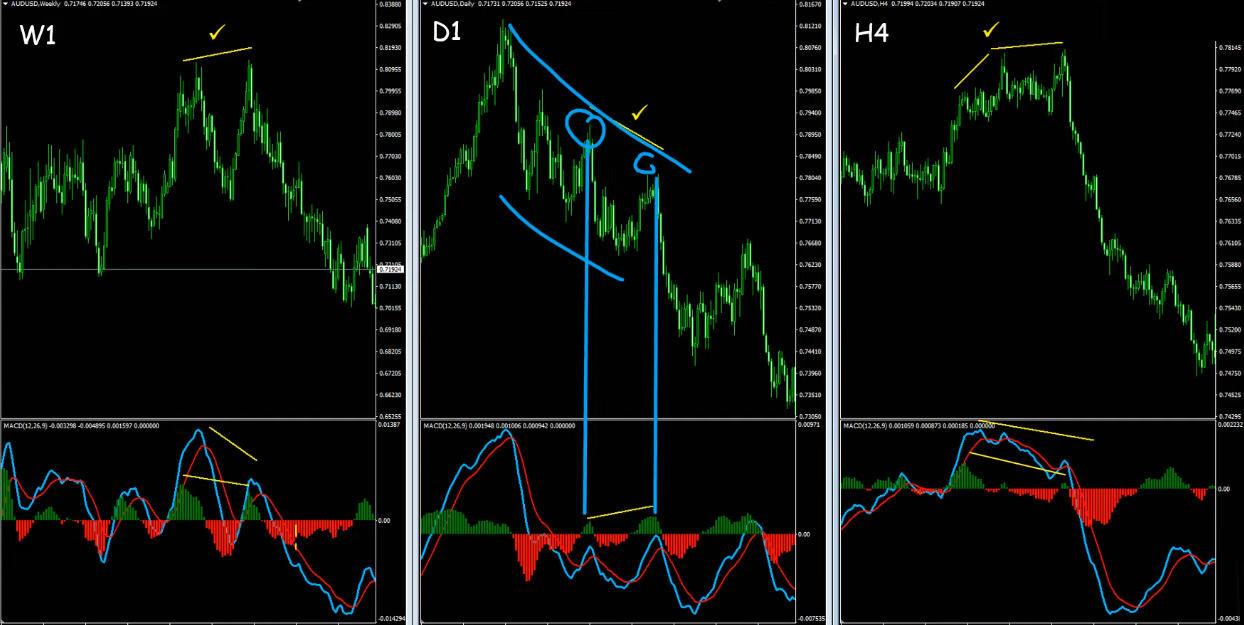
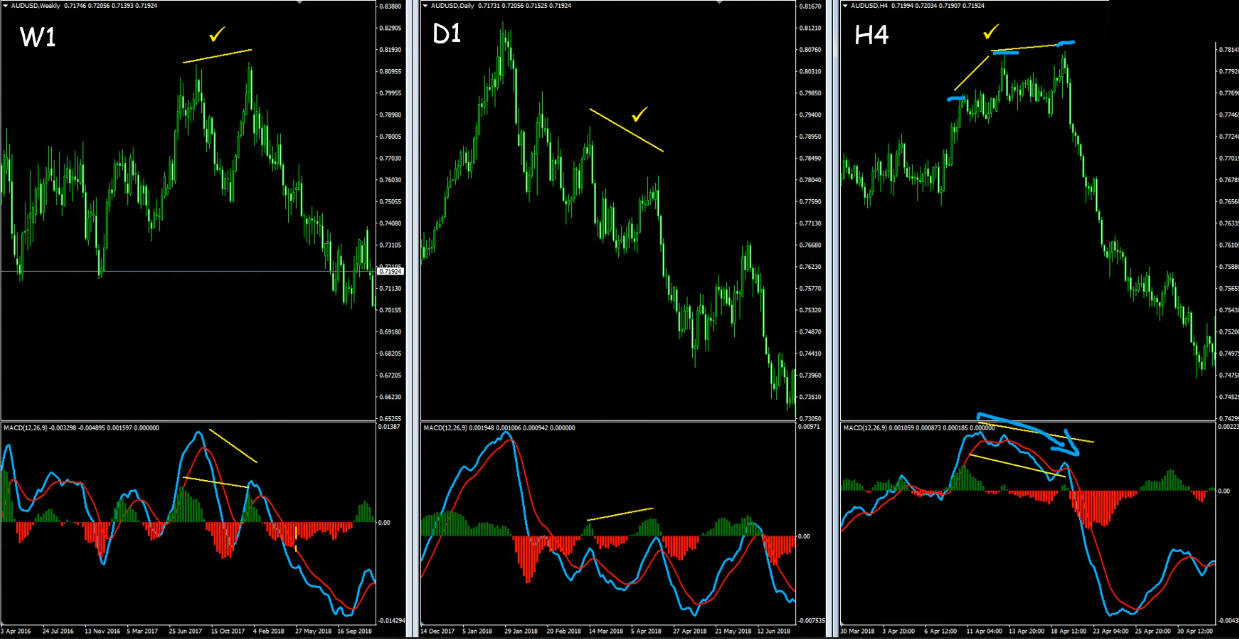
In the above chart on the daily timeframe, we have a bearish trend and the price has created lower highs at the same time we have higher highs on the MACD histogram thus forming a bearish hidden divergence.
Now we have two things to do, first, we need to go to the higher timeframe and verify that the higher timeframe is not against us.
When we check the weekly timeframe in the chart below, we can see that the last divergence is bearish and there are no obstacles against us.
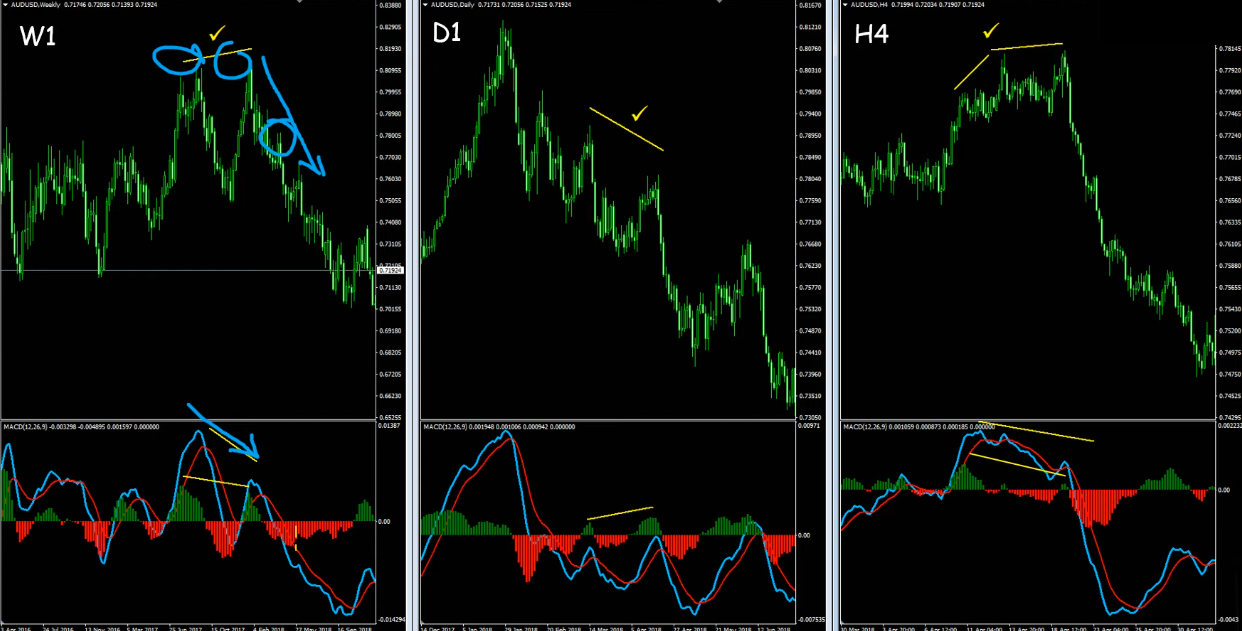
Next, we go to the lower timeframe to verify the trend is ready to continue and the correction is ending (for basic divergence types). While checking in the chart below we can see that the price is going up while at the same time the higher is going down on the MACD creating a classic basic type of divergence and we know that the trend is more likely to continue.
There are many variations to enter the trade as an entry strategy, many day traders use different approaches and it is more than okay (and practiced). The most important reminder is to stick with the definitions that I use, three possibilities for entry:
1. The break of the most recent low as shown in the screenshot below on the left chart with the basic divergence, would be the conservative entry.
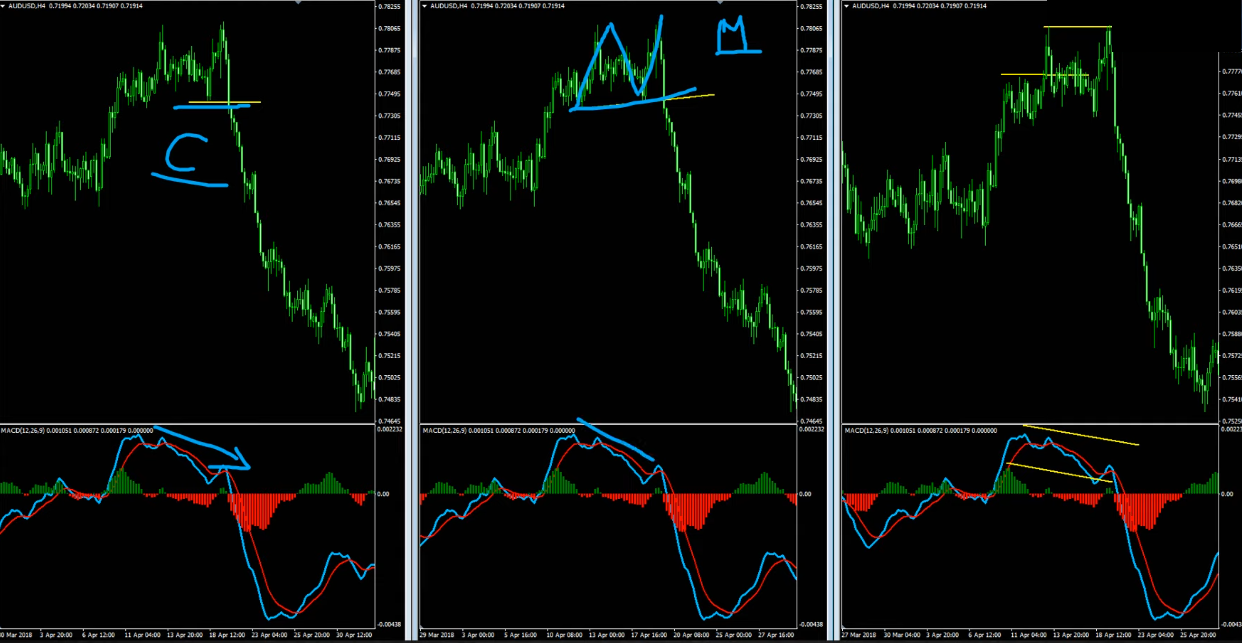
2. The next one would be the moderate entry and it would be the break of the most recent trend line as shown in the screen above on the middle chart where we can spot a divergence.
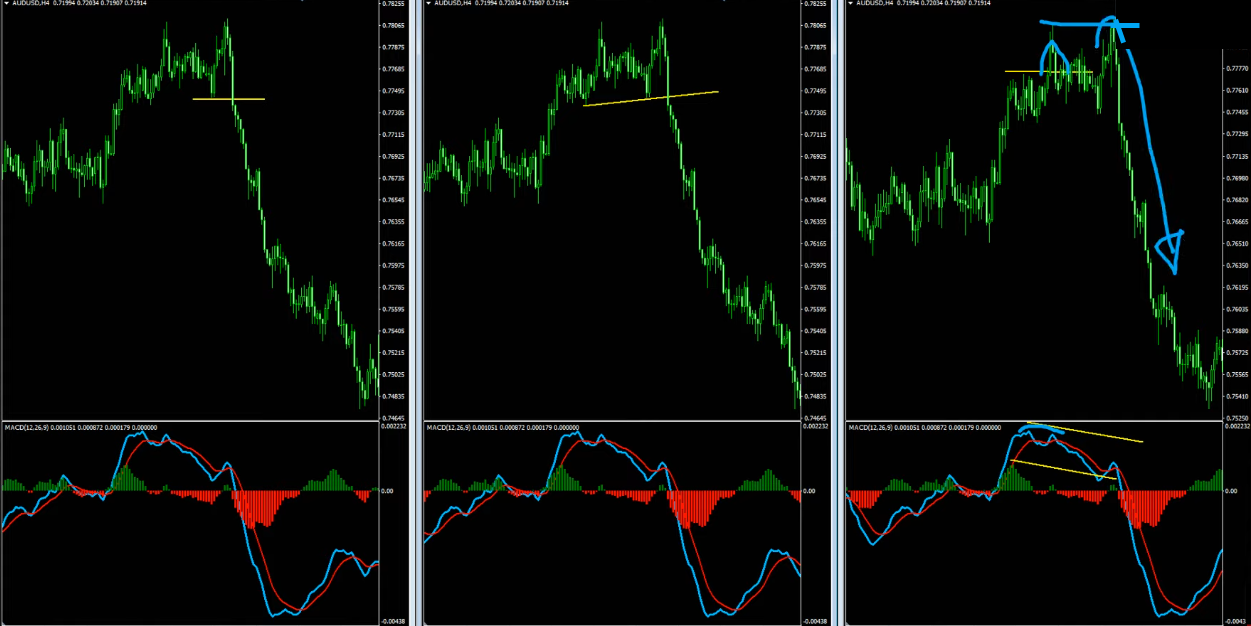
3. The more aggressive approach would be to attack false breakouts and as you can see on the chart above it starts with divergence and we had a false breakout (but this one would fail) creating one more high and then the price created the next false breakout with the next divergence and paid with an amazing movement.
Naturally, the most conservative approach would give you loss in terms of risk-reward and the Moderate Approach is as it sounds (neutral grounds).
The aggressive approach would result in an increased risk-reward where volume isn’t the sole way the trading factor done.
Online Trading: – [Starting Small, Rolling Big]
What is best for you?
Some traders prefer the aggressive approach and are able to mitigate small losses as long as they get the big paycheck while some other investors prefer the conservative approach.
It’s optimal to stick to approaches that work for you.
There could be many different approaches here like the Moving Average Cross, Fibonacci Levels, etc…
It could be anything but the first thing starts with a definition when you define the hidden divergence correctly and verify it correctly then you can have better chances to be right.
[Sneak Peek into Our Hidden Divergence Webinar]
Improve Day Trading With Us By Joining Me In Live Trading Rooms.


great lesson Vlad….thank you 🙂
You are welcome Mihail
Thank you Vlad for the information here..
These hidden divergence principle explained at its best
Thank you for sharing it