Hi Traders! NZDCHF forecast follow up and update is here. On February 3rd I shared this “NZDCHF Forecast And Technical Analysis” post in our blog. In this post, let’s do a recap of this setup and see how it has developed now. If you would like to learn more about the way we trade and the technical analysis we use then check out the Traders Academy Club. Spoiler alert – free memberships are available!
My Idea
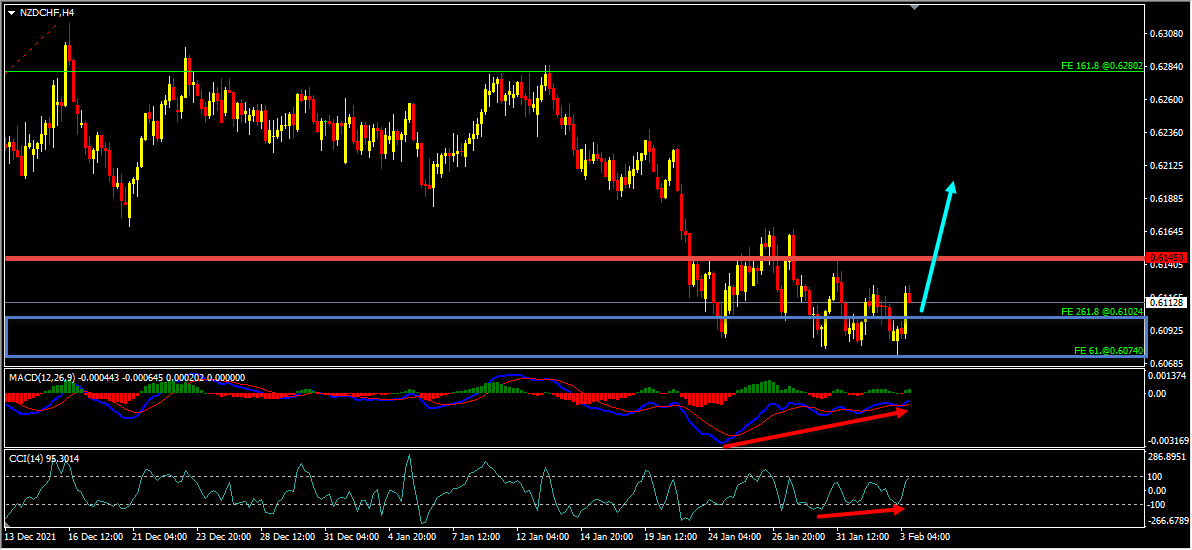
Looking at the H4 chart, we could see that the price which is moving lower has created multiple false breaks with a bullish divergence between the first low that has formed at 0.60876 and the second low that has formed at 0.60740 based on the MACD indicator, we may consider these as evidences of bullish pressure. We also have this bullish divergence on the CCI indicator as well, which we may consider as yet another evidence of bullish pressure. So based on all this my view here is bullish and if the price moves higher and if we get a valid breakout above the high at 0.61450 we may then consider it as a validation for the bullish view and may expect the price to move higher further. Alternatively if the price moves lower, breaks and holds below the key support zone then this bullish view will be invalidated.
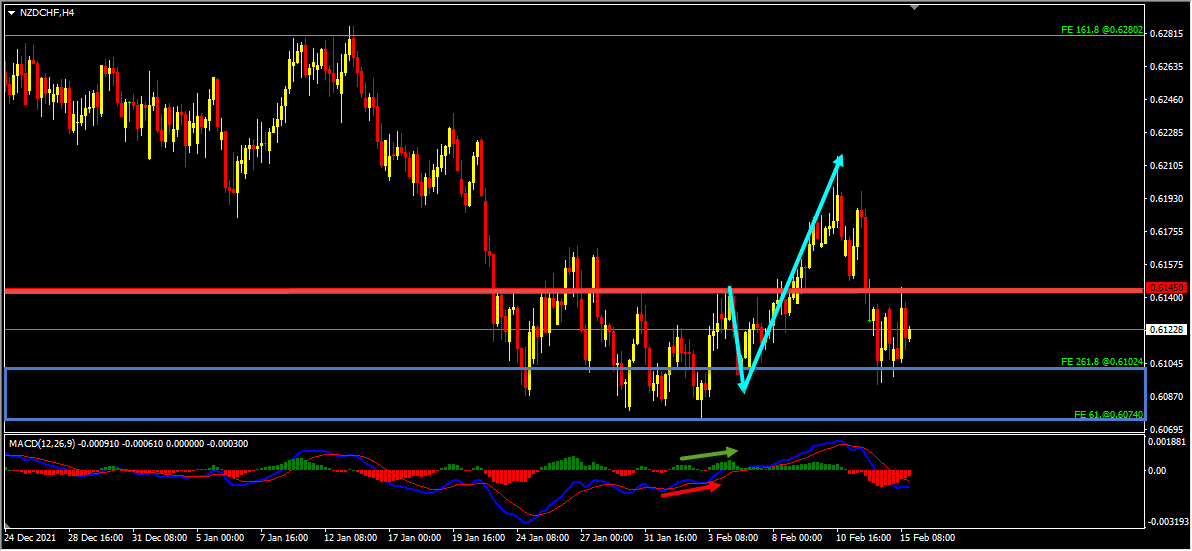
In this pair based on the above-mentioned analysis, my view was bullish here and I was expecting the price to move higher further until the key support zone holds. Also, I mentioned that “if we get a valid breakout above the high at 0.61450 we may then consider it as a validation for the bullish view and may expect the price to move higher further”. The price action followed my analysis exactly as I expected it to here. The validation for the bullish view which is a valid breakout above the high at 0.61450 happened as I expected it to. We then had a pullback and then the price moved higher further and delivered 120+ pips move.
The market provided us with various facts supporting the bullish view here. On the H4 chart, the price created a bullish divergence between the first low that has formed at 0.60822 and the second low that has formed at 0.60740 based on the MACD indicator. The price then moved higher and broke above the last high at 0.61252 thus creating a classical setup of bullish divergence followed by bullish convergence. Generally, after a bullish convergence we may expect pullbacks and then further continuation higher. The pullback happened and then the price moved higher further delivering a wonderful move to the upside as you can see in the image above.
So traders, when it comes to trading, there are various important factors that we need to pay attention to, just because we have a good setup doesn’t mean that we can enter the trade randomly and it will pay us huge profits. First of all, we need to validate the entry and we should have a perfect entry plan to get into the trade which is a key factor when it comes to trading. This NZDCHF forecast is yet another good example of this scenario.
For trade ideas, real-time trading education and much more I invite you to
Also, you can get one of our strategies free of charge. You will find all the details here
If you have any further questions, don’t hesitate to drop a comment below!
Happy Trading!
Arvinth Akash
Traders Academy Club Team
Hi Traders! Arvinth here from the Home Trader Club team. The weekly summary and, review of March…
Europe’s bonds will struggle to bounce back from a sharp selloff triggered by the war…
Hi Traders! GBPUSD short term forecast and technical analysis is here. We do our analysis…
Hi Traders! SP500 short term forecast update and follow up is here. On December 18th,…
Hi Traders! AUDNZD short term forecast and technical analysis is here. We do our analysis…
Hi Traders! USDJPY short term forecast update and follow up is here. On January 29th,…