Hi Traders! NZDJPY forecast update and follow up is here. On June 23rd I shared this Technical Analysis – NZDJPY Forecast in my blog. In this post, let’s do a recap of this setup and see how it has developed now. If you would like to learn more about the way we trade and the technical analysis we use then check out the Traders Academy Club. Spoiler alert – free memberships are available!
Missed this trade?
Never miss a trade opportunity again! Join the Traders Academy Club
Now let’s summarize the idea first:
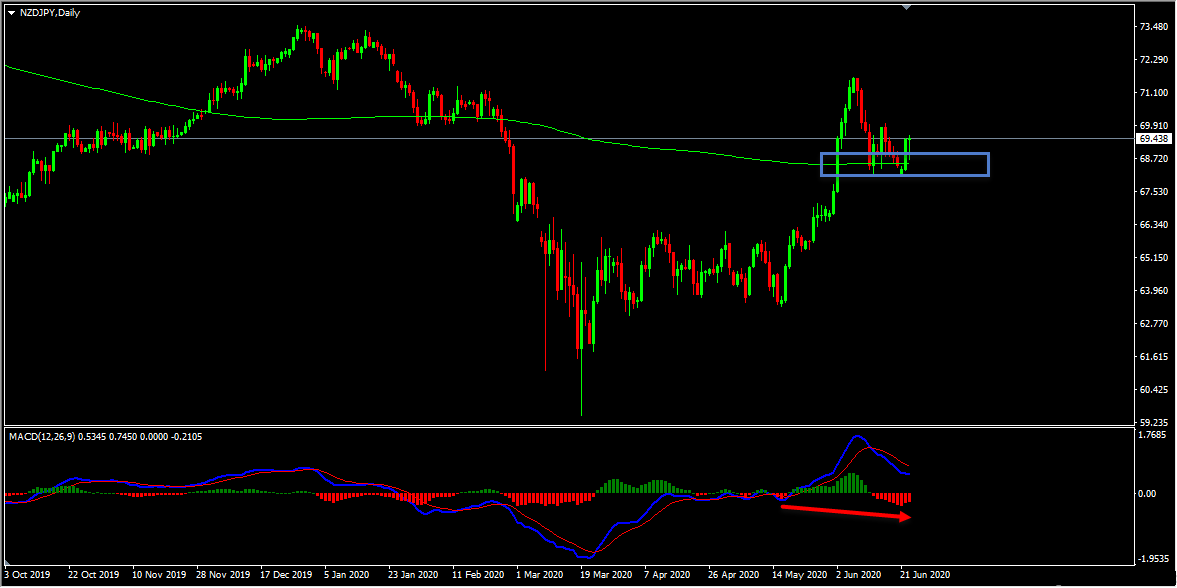
On the daily chart the price which was moving lower reached a key support zone formed by the 200 moving averages, respected it, and is currently holding above it. Also in addition to this we have a hidden bullish divergence that has formed between the first low that has formed on 17th May 2020 and the second low that has formed on 21st June 2020 based on the histogram of the MACD indicator which we may consider as evidence of bullish pressure. We may now move down to lower timeframe and see if we can find evidences supporting this bullish view.
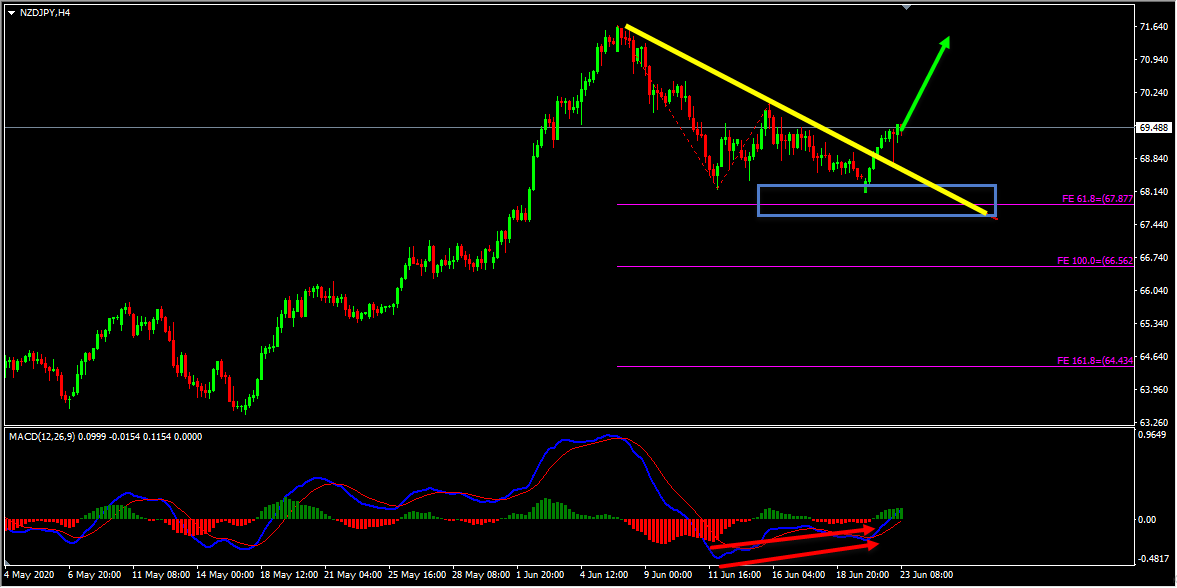
On the H4 chart, we had a double wave to the downside and while measuring the first leg of this double wave we had three important support zones that have formed based on the fibonacci expansion levels. The price which was moving lower reached the first support zone at 61.8% (67.877) fibonacci expansion level, respected it, and is currently moving higher. We also had a bullish divergence between the first low that has formed on 12th June 2020 and the second low that has formed on 21st June 2020 which we may consider as evidence of bullish pressure. In addition to this, the price which was moving higher has currently broken above the most recent downtrend line which we may consider as another evidence of bullish pressure. So until the important support zone at 61.8% (67.877) fibonacci expansion level holds my view remains bullish here and I expect further continuation higher.
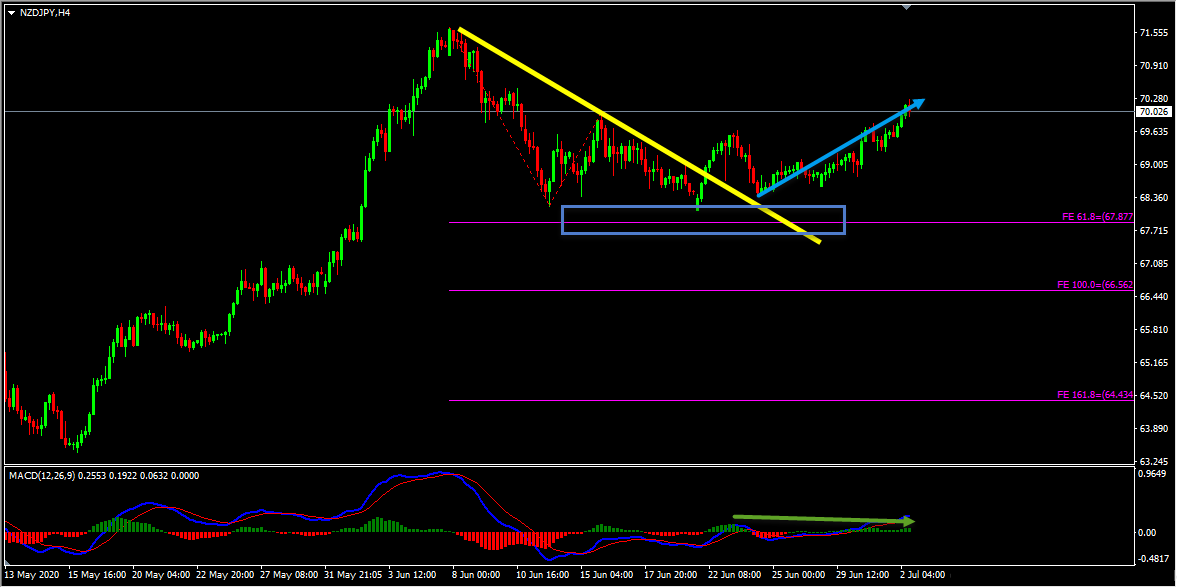
So based on this technical analysis I mentioned that “Until the important support zone at 61.8% (67.877) fibonacci expansion level holds my view remains bullish here and I expect further continuation higher”. After the breakout of the downtrend line the price retested the breakout and then it moved higher further exactly as I expected delivering 180+ pips move. Currently, we have bearish divergence in play on both H4 and H1 chart, this is something that we definitely need to pay attention to. So if you are still involved in the buys then this is a very important place to consider and manage your trade (cash out or partial cash out or trailing protections or partial hedge, etc.. depending on the strategy that you work with).
Note: If you want to learn about Money Management you can find it here
As traders we should always follow the facts, it doesn’t matter what view you had yesterday, what matters is what happens in the market today because the market is dynamic and it doesn’t necessarily have to agree with the way you see it. As long as the market follows my ideas and validates my setups I can trade and if it doesn’t switch, have a different read and turn around when required.
For similar trade ideas and much more join the Traders Academy Club and get access to our complete watch list and trade report.
This is how the report looks like. A table with the hottest market opportunities, screenshot behind every pair and time frame (anything that is in blue inside the table is clickable and leads to a screenshot) + a summary in text format, kind of highlights. And of course Live Market Analysis every single day.
Happy Trading!
Yordan Kuzmanov
Chief Trader at the Traders Academy Club
Hi Traders! USDCHF short term forecast update and follow up is here. On May 20th,…
Hi Traders! CADCHF short term forecast and technical analysis is here. We do our analysis…
The dollar was broadly steady on Monday as cautious investors watched out for signals on…
Hi Traders! Arvinth here from the Home Trader Club team. The weekly summary and, review of July…
European markets edged lower on Thursday following more overnight volatility in Asia’s tech-dominated indexes, while…
Hi Traders! EURGBP short term forecast and technical analysis is here. We do our analysis…