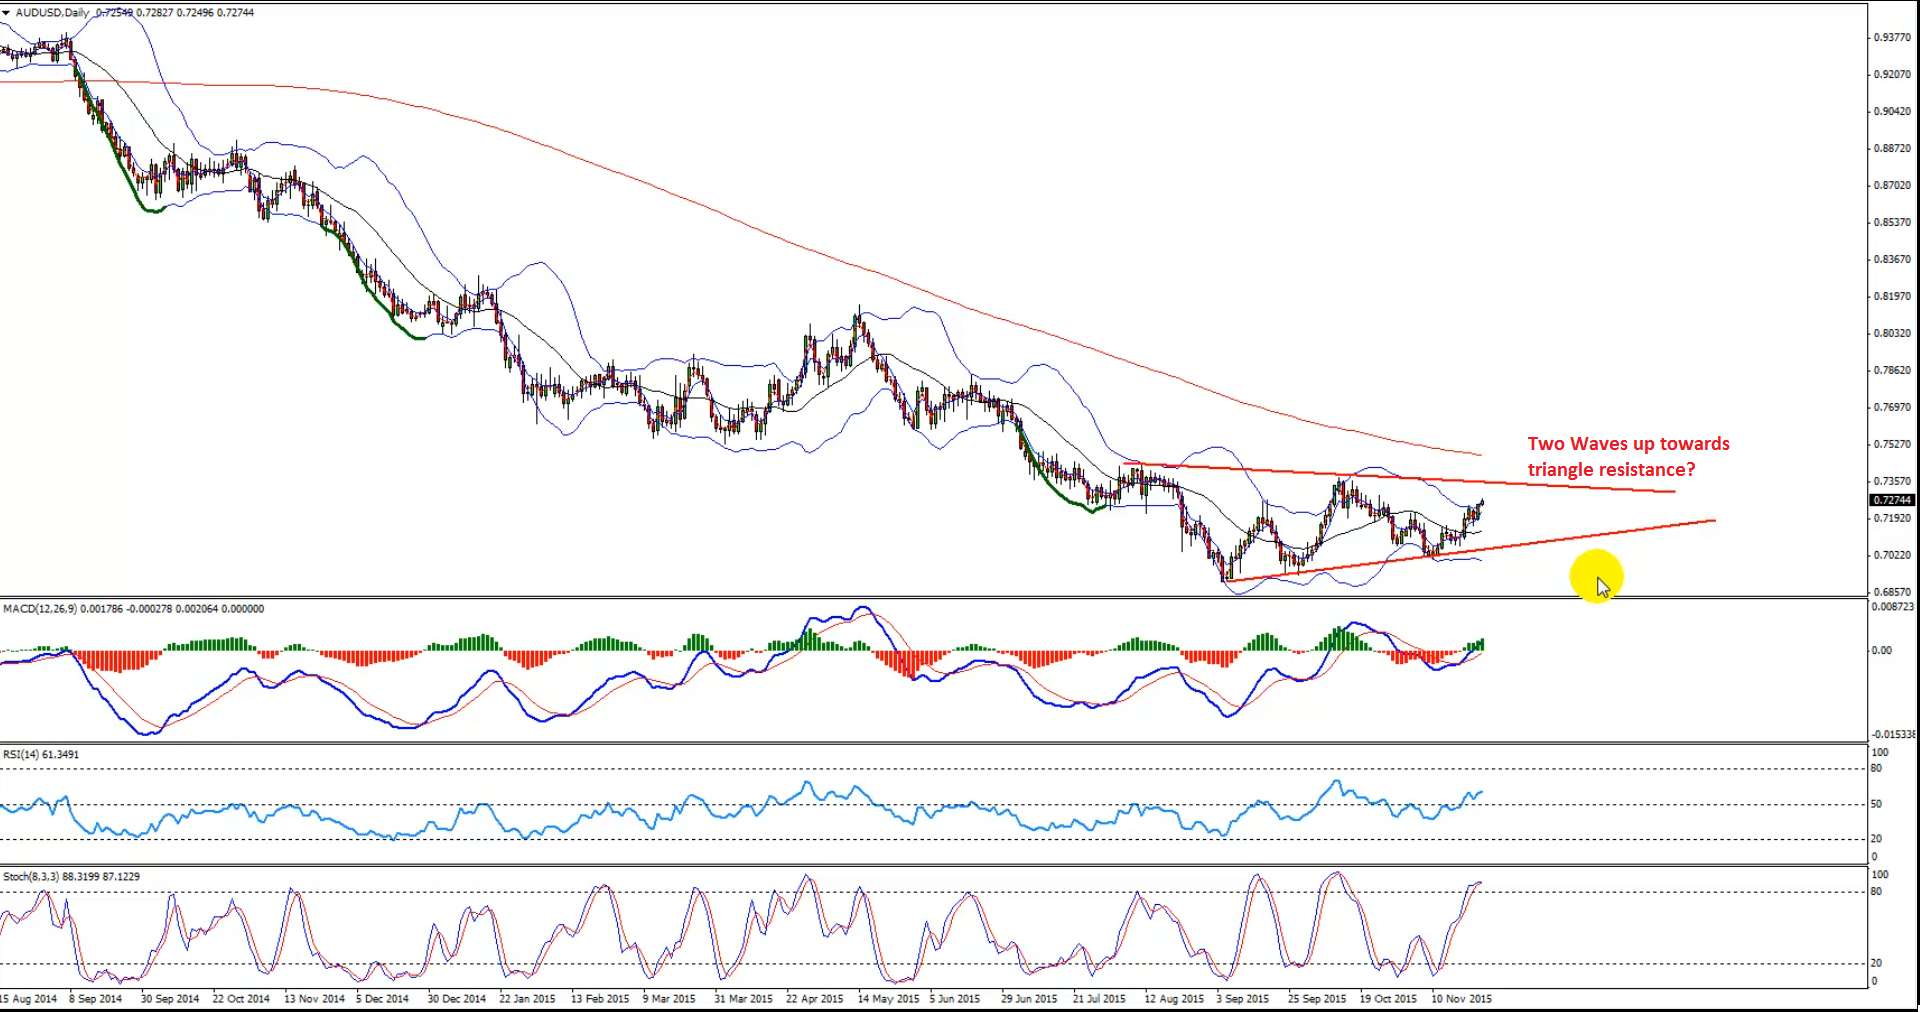
The Aussie Dollar is enjoying a nice bullish ride against the US Dollar, which may continue in the near term. There is a chance of two waves up towards the triangle resistance area formed on the daily chart. In that situation, we may consider entering a sell trade.
In the short-term, I think the AUDUSD pair might head higher after a minor correction. There is a 20-candles ride already, which means it might correct lower, presenting us a buying opportunity.
Technical Analysis
D1– Chart highlighting the possibility of a move towards the triangle resistance area.
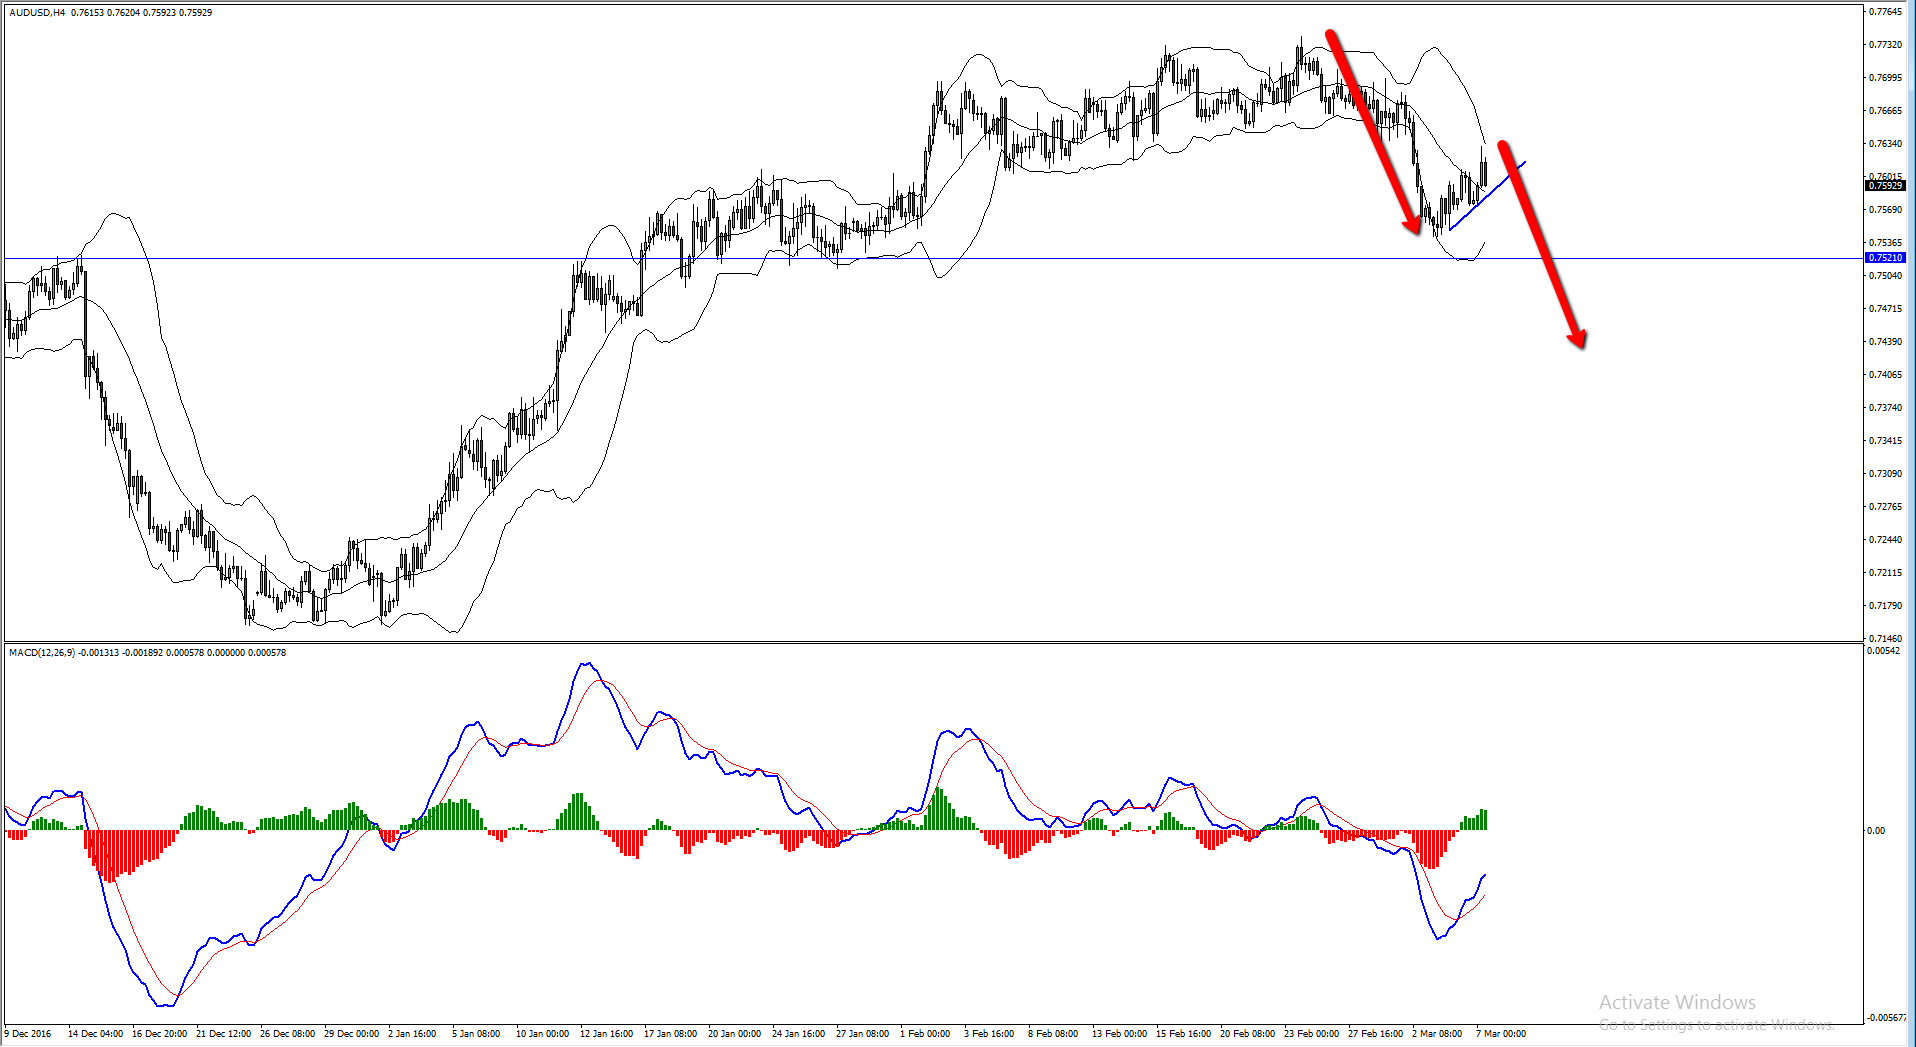
Sell Entry:
H4– We can enter a sell trade in the AUDUSD pair if it moves higher towards the highlighted two waves up resistance area near 0.7340.
Target 1: 0.7220
Target 2: 0.7180
Stop Loss: Break and close above the highlighted triangle resistance area on the 4-hours chart.
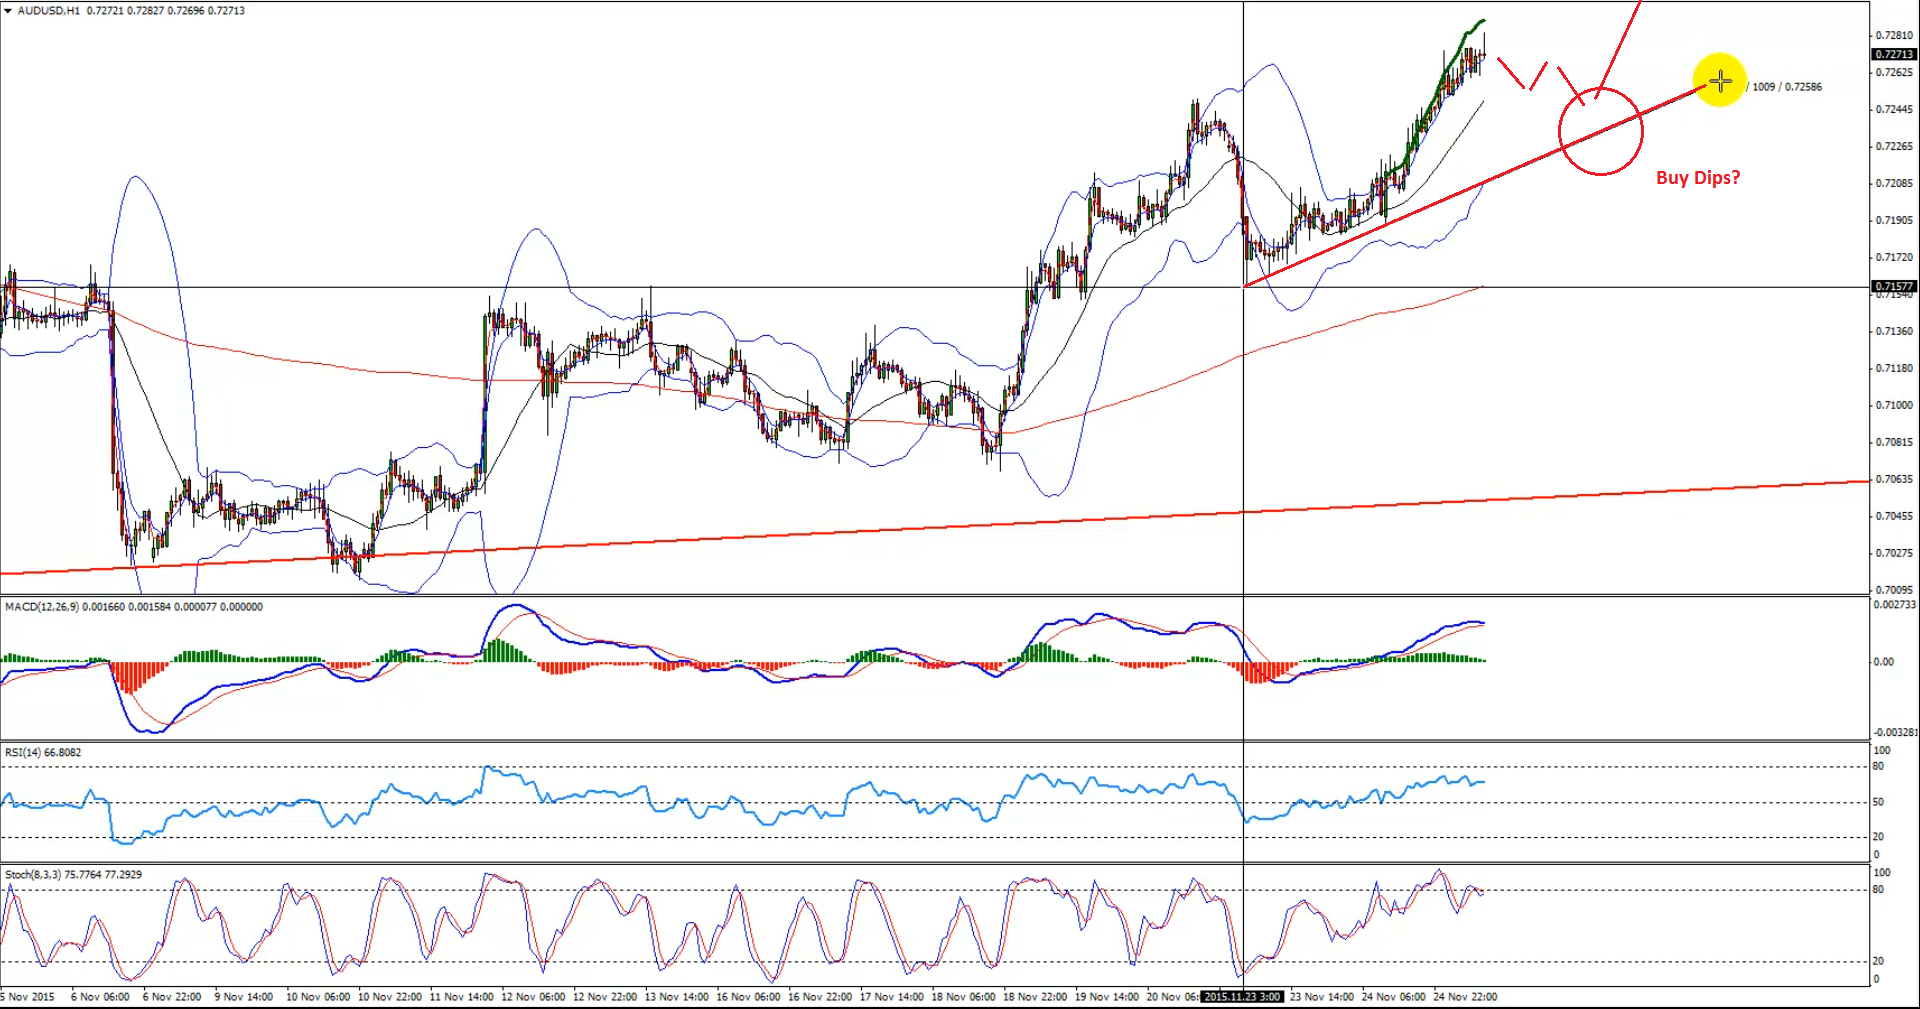
Buy Entry:
H1– We can enter a buy trade in the AUDUSD pair if it moves down in two waves towards the trend line, and forms a bullish divergence.
Target 1: 0.7300
Target 2: 0.7340
Stop Loss: Below 0.7150
Video Explanation:
Yours,
Vladimir
Hi Traders! Arvinth here from the Home Trader Club team. The weekly summary and, review of March…
Europe’s bonds will struggle to bounce back from a sharp selloff triggered by the war…
Hi Traders! GBPUSD short term forecast and technical analysis is here. We do our analysis…
Hi Traders! SP500 short term forecast update and follow up is here. On December 18th,…
Hi Traders! AUDNZD short term forecast and technical analysis is here. We do our analysis…
Hi Traders! USDJPY short term forecast update and follow up is here. On January 29th,…