Hi friends,
For those of you who trade the natural gas, I think we are right before a strong bearish down move.
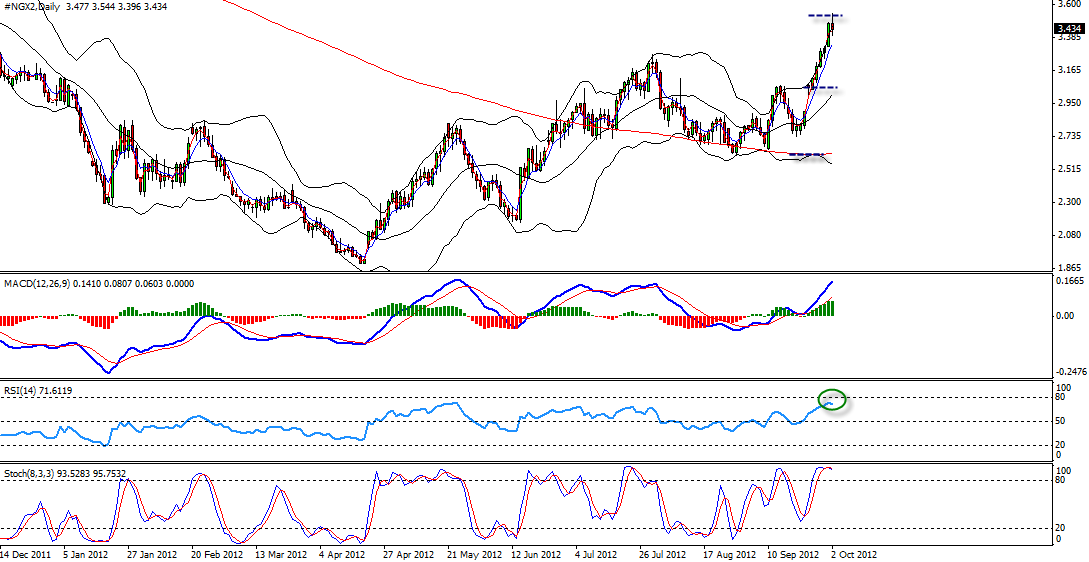
On daily chart we can see RSI is almost around extreme level, while BB is almost duplicated.
Here is the chart (Click to enlarge):
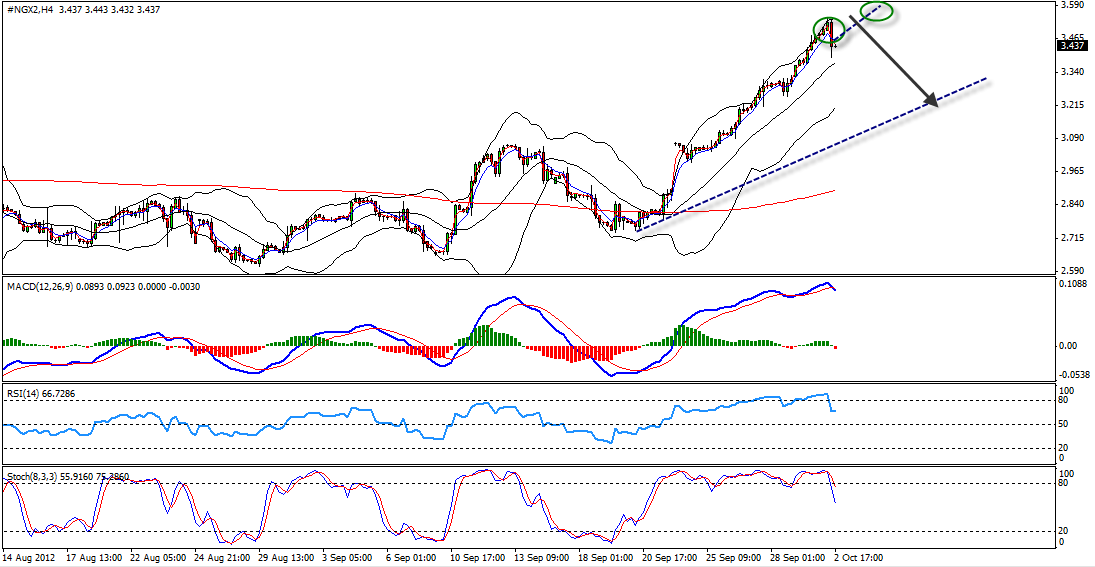
And on 4H chart we can see long amazing divergence with RSI dancing above extreme. A powerful retrace down to the trend line AT LEAST is a question of time.
Here is the chart (Click to enlarge):
But cycle as cycle, before the crash down we might see attempt to push to 3.55 or 3.65 even. But it will be BLUFF as the commodity is in its extreme top and will retrace soon
Enjoy the trade
Vladimir Ribakov
www.vladimirforexsignals.com
Hi Traders! Arvinth here from the Home Trader Club team. The weekly summary and, review of March…
Europe’s bonds will struggle to bounce back from a sharp selloff triggered by the war…
Hi Traders! GBPUSD short term forecast and technical analysis is here. We do our analysis…
Hi Traders! SP500 short term forecast update and follow up is here. On December 18th,…
Hi Traders! AUDNZD short term forecast and technical analysis is here. We do our analysis…
Hi Traders! USDJPY short term forecast update and follow up is here. On January 29th,…