Hi Traders! This is the continuation of the first article on Bollinger Bands. In this part 2 I will show you more secret patterns on the Bollinger bands that will change your trading tremendously. These techniques are great for beginner and advanced forex traders. The secret patterns that you will learn how to trade are:
Lets see an example of Bollinger Bands Duplications
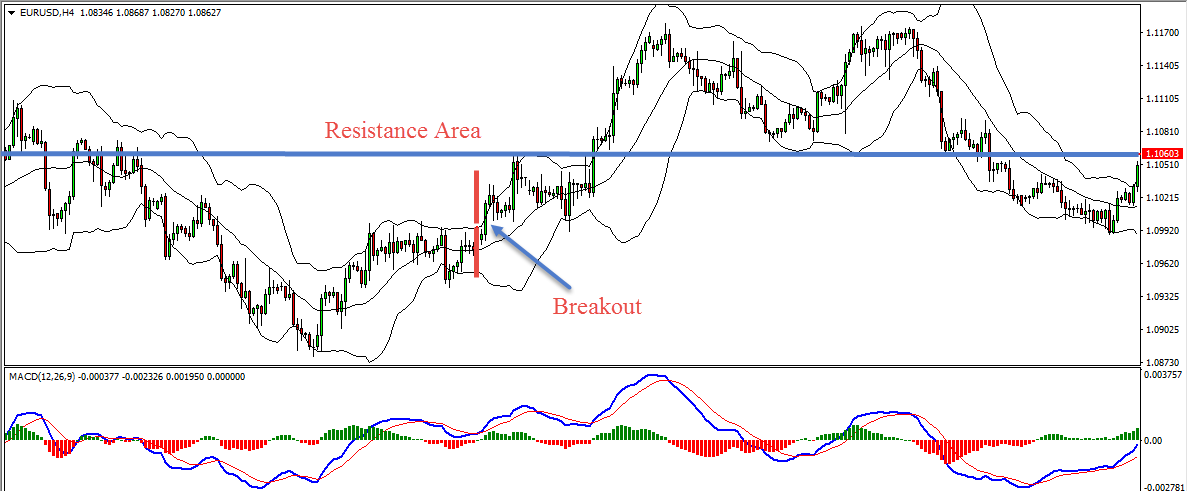
In the below H4 chart we had a breakout of the Bollinger Bands, after the breakout the price moved to the upside, it duplicated the area shown in the chart one time higher and reached a stiff resistance area.
After I recognized this situation I am looking for bearish divergence on the same timeframe or one timeframe lower. As there was no bearish divergence on the H4 chart we moved down to one timeframe lower which will be the H1 chart in this case, generally we will be looking for any divergence here supporting our trading direction (If you want to learn more in-depth insights about divergences, you can benefit greatly from the videos on my channel here while also embarking upon Divergence University for comprehensive divergence education). On the H1 chart we had a bearish divergence and the area shown in the image below (marked in green circle) is an amazing one to look for sells.
Remember that Bollinger Bands is not a strategy or method, it is a visual tool to understand that a certain area is critical. Also keep in mind that Bollinger Bands could duplicate itself once or twice, if it duplicates more than that then it becomes irrelevant anymore.
Here is one more example of Bollinger Bands Duplications
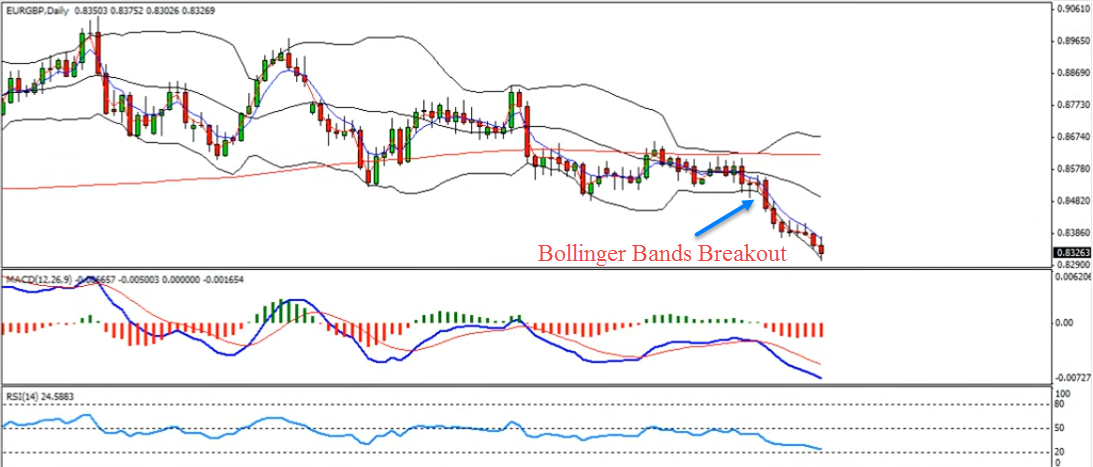
In the below D1 chart we had a breakout of the Bollinger Bands, after the breakout (make sure that the Bollinger Bands are open and there is no retrace) the price moved to the downside, it duplicated the area shown in the chart one time lower and reached a stiff support area and we had a bullish divergence (here in this case we had a divergence on the same timeframe) which makes the area shown in the image below (marked in green circle) an amazing one to look for buys.
In the below example we had a breakout of the Bollinger Bands to the downside, we can see here that the upper boundary is aiming up and the lower boundary is aiming down, this means that they are opened, this is what we call it as a Bollinger Bands breakout.
When you find a duplication area confirm it with other things for example like supports, resistances, trend lines, fibonacci levels, etc… on the same timeframe or one timeframe higher. Remember this very important rule “Divergences – we will look to attack on the same timeframe or lower timeframe and Confirmations like supports, resistances, trend lines, fibonacci levels, etc… we are looking on the same timeframe or one timeframe higher” For example if I am working on H4 chart my confirmation will be on the Daily chart but my divergence will be on H1 chart.
Here is an example of Bollinger Bands Riding
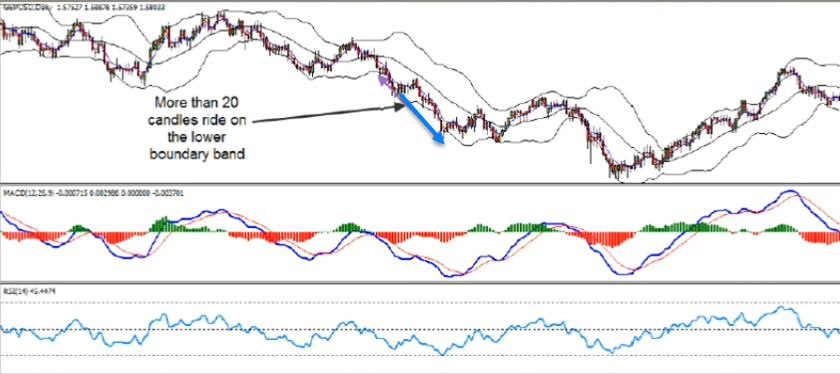
The reason why we are looking for 20 candles is because of the moving average, the reason is simple because prices will always try to go back to their value zone. The value zone is the moving average which in this case is the 20 MA(moving average). The prices will always try to go back to the value zone once they are riding out of the value zone. This is why we look for at least 20 candles ride and after that they will try to retrace back to the value zone. Remember this very important thing, the Bollinger Bands is 20 moving average with two deviations +2 and – 2, that’s exactly the boundaries we have. Once the prices are riding one of the boundaries, in the above example it is riding the negative (-2) they will try to go back for its average which is the opposite boundary band (20 +2) because the price is riding the -2 deviation. So based on the above example after the 20 candles ride we need to confirm it with supports, trend lines, fibonacci levels, etc… on the same timeframe or one timeframe higher then we had a bullish divergence on the same timeframe and this is our area to look for buys.
Here is one more example of Bollinger Bands Riding
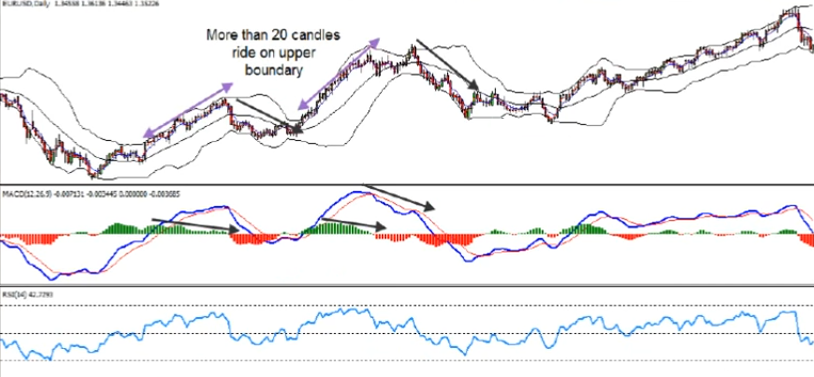
In the above example on the daily chart we have double (twice) Bollinger Bands riding move on the upper band as shown in the screenshot then we confirmed it and also we had a bearish divergence then the price retraced to the opposite band.
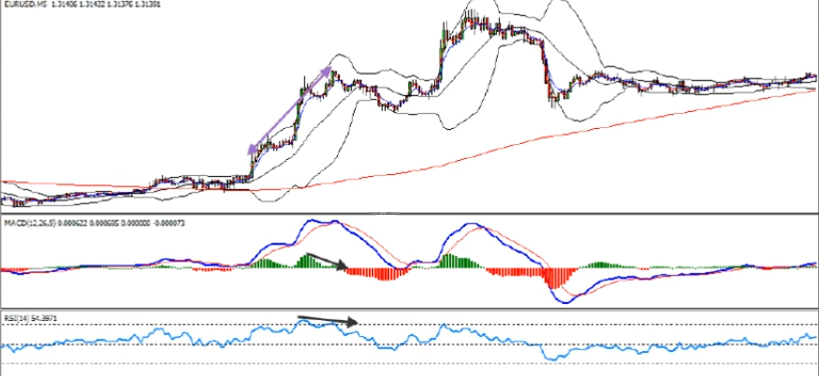
Here is another tool that I wanted to teach you which is the RSI, here with the Bollinger Bands riding it is relevant more than ever. With the 20 candles Bollinger Bands riding many times you will see the RSI kissing the 80 or 20 or crossing above or below it, together with divergence, if this happens then it will make the area much more reliable to attack.
Here is an example of Bollinger Bands riding with RSI
So traders, this is what I wanted to share with you all about the “Bollinger Bands Secret Pattern”.
Watch the webinar of Bollinger Bands Secret Pattern – Part 2
I invite you to join me in my live trading rooms, on daily basis, and improve your trading with us.
Also you can get one of my strategies free of charge. You will find all the details here
Thank you for your time reading this article.
To your success,
Vladimir Ribakov
Hi Traders! USDCHF short term forecast update and follow up is here. On May 20th,…
Hi Traders! CADCHF short term forecast and technical analysis is here. We do our analysis…
The dollar was broadly steady on Monday as cautious investors watched out for signals on…
Hi Traders! Arvinth here from the Home Trader Club team. The weekly summary and, review of July…
European markets edged lower on Thursday following more overnight volatility in Asia’s tech-dominated indexes, while…
Hi Traders! EURGBP short term forecast and technical analysis is here. We do our analysis…