


Hi Traders,
RSI (Relative Strength Index) is one of the most common trading indicators used by day traders and for good reason.
Due to its popularity and vast sum of users, the indicator has made its way to become one of the default indicators that you get in your trading platform and that applies to probably all of the platforms that you will find out there.
It is remarkably simple to use, easy to understand how it works and if used correctly you will be amazed what a good job it does. So let’s begin.
The relative strength index was developed by J.Welles Wilder and published in a 1978 book, New Concepts in Technical Trading Systems, and in Commodities magazine (now Futures magazine) in the June 1978 issue. As a result, it has become one of the most popular oscillator indices.
The RSI aims to chart the current and historical strength or weakness of a stock/instrument based on the closing prices of a recent trading period.
The RSI is classified as a momentum oscillator.
Momentum is the rate of the rise or fall in price.
The RSI computes momentum as the ratio of higher closes to lower closes: Instruments which have had more or stronger positive changes have a higher RSI than instruments which have had more or stronger negative changes.
The RSI is most commonly used on a 14 day time frame, measured on a scale from 0 to 100, with high and low levels marked at 70 and 30, respectively. Shorter or longer time frames are used for alternately shorter or longer outlooks. More extreme high and low levels -80 and 20, or 90 and 10- occur less frequently but indicate stronger extreme levels.
Even though the default timeframe is 14 days many day traders try to change it, I belong to this part of the traders that believe if it’s good to use 14 then definitely it should be good enough for me as a trader. So I believe less in all the modifications like RSI 15, 16, 17, 18, 20 or 21.
Yes in period this could provide better signals but remember the purpose and the final output correlation was given as it is and there is a reason why it is used as default (It’s just my personal view).
The formula – For each trading period an upward change U or downward change D is calculated. Up periods are characterized by the close being higher than the previous close:

Conversely, a down period is characterized by the close being lower than the previous period’s close (note that D is nonetheless a positive number)

If the last close is the same as the previous, both U and D are zero. The average U and D are calculated using an n-period smoothed or modified moving average (SMMA or MMA) which is an exponentially smoothed moving average with α = 1/period. Some commercial packages, like AIQ, use a standard exponential moving average (EMA) as the average instead of Wilder’s SMMA.
Wilder originally formulated the calculation of the moving average as: newval = (prevval * (period – 1) + newdata) / period. This if fully equivalent to the aforementioned exponential smoothing. New data is simply divided by period which is equal to the alpha calculated value of 1/period. Previous average values are modified by (period -1)/period which in effect is period/period – 1/period and finally 1 – 1/period which is 1 – alpha.
The ratio of these averages is the relative strength or relative strength factor:

If the average of D values is zero, then according to the equation, the RS value will approach infinity, so that the resulting RSI, as computed below, will approach 100.
The relative strength factor is then converted to a relative strength index between 0 and 100:

The smoothed moving averages should be appropriately initialized with a simple moving average using the first n values in the price series.
Here is an example of how the RSI indicator looks like:

You can adjust the colors, levels, etc… as you wish, I just want you to remember since this is stable unchanged levels (100 to 0) the strengths of that would be mainly for possible reversals and would mainly be in non trending conditions. In trending conditions it will be impossible to spot these extreme points that would cause a reversal.
The Level 50 Inside A Trend

The level 50 which stands in the middle between the 100 and 0 or at the middle in between 70 and 30. This level is critical when we are dealing with obvious trends. You will see many times when the trend is real and stable the RSI would hold below 50 or atleast will try to break but fail and will go down again. You can see those periods in the example above. When you start to see it crossing over and over again you would get un-trending conditions, this would be a good verification that your trend is atleast on the temporary view is over (Same would be the vice versa for the uptrend).
RSI Breakout

One of the most common uses of the RSI indicator is to verify breakouts, many traders just love to synchronize trend lines on the chart and RSI and get into the breakout, which is good. I personally prefer to see where the patterns created on the chart are pretty much the same as the patterns of the RSI, then you have a clear picture of the Relative Strength Index in the whole movement, in this way it is much more powerful and the breakout is more reliable.
If you connect the highs on the chart and the highs on the RSI you would get pretty much the same pattern. You can find an example of it below:

Even though this is one of the most powerful and the most used methods for the RSI by day traders it still has to be done correctly otherwise you will get disappointed from it. The reason for that is because the breakout itself is a great representation by the relative strength index value and the price movement. But when you can combine not just the very current breakout but the whole price movement before the breakout happened then you have much more value in it and better chances to be right.
RSI Extremes
The RSI is most typically used on a 14 day time frame, measured on a scale from 0 to 100 with high and low levels marked at 70 and 30, respectively. Shorter or longer time frames are used for alternately shorter or longer outlooks. More extreme high and low levels -90 and 10- occur less frequently but indicate stronger momentum.
Wilder posited that when price moves up very rapidly, at some point it is considered overbought. Likewise, when price falls very rapidly, at some point it is considered oversold. In either case, Wilder deemed a reaction or reversal imminent.
I personally use the levels of 80 and 20 as I find them more reliable.
RSI – What Not To Do

The logic we think as traders is if it goes up too much it has to retrace and when it goes down too much it has to retrace, this logic is correct because when it comes to trading nothing is moving in one way there will be reversals here or there.
The RSI is showing you the relative strength index of the very current movement compared to the previous conditions, the fact that it is very high doesn’t mean that the trend has reached its end, it just means its high relatively compared to the previous levels.
You don’t have to rush just because the level reached high, it means nothing. You can try but it’s not a strategy to rely on or to work with for real trading and generate consistent profits. You need to understand the logic behind the indicator, the top doesn’t represent the end of a trend and in trending conditions this would act like a track, it would be very good and reliable in ranging conditions.
RSI – Trading Strategy
One of the purpose that traders use RSI for is to find divergence (if you want to learn about divergence, you can join my Divergence University course here). The way I use the RSI is in multiple timeframe, my favorite method is multi timeframe divergence and the combination of the breakout which I showed you before. This combo is basically representing two approaches:
- Potential end of a trend.
- Verification for a possible breakout and continuation in reversal conditions and at the beginning of a new trend.
So I am trying to catch this move as it happens at the beginning of a possible developing trend or atleast in the deep correction to come after possible long term divergence.
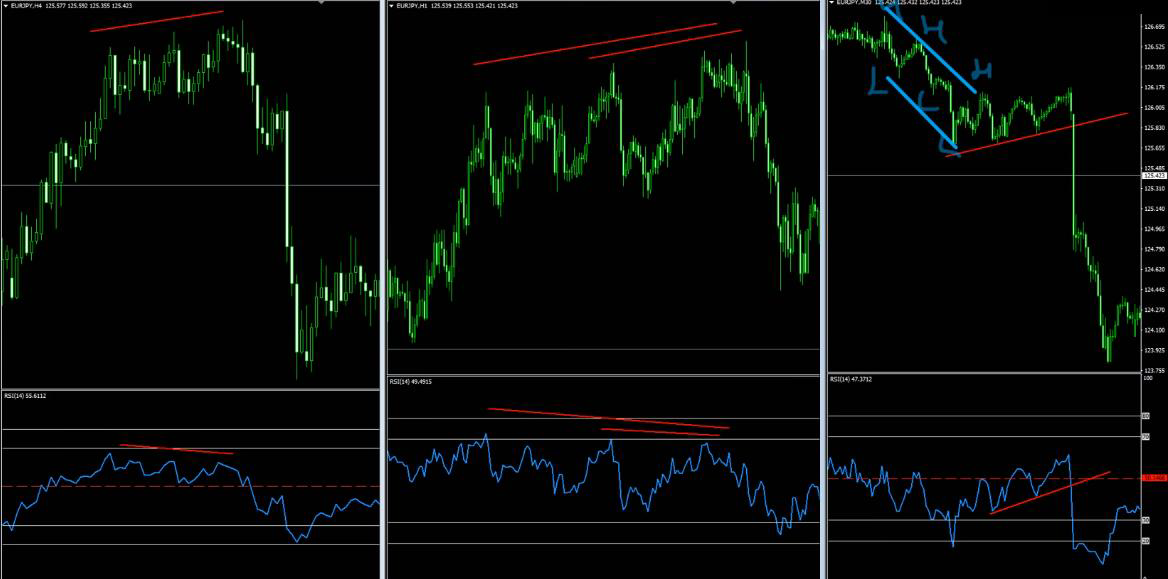
I use this for any different following three timeframe combination (for example H4, H1 and M30) You can use it for any three following timeframes of your choice.

In the above example, if we start with the highest one that is the H4 chart we have higher highs on the chart and lower highs on the indicator thus indicating a divergence. At that very situation I go to the H1 chart and I verify that there are fake highs on the chart followed by lower highs on the RSI as well.
What I want to do next is to get the move down to begin and verify myself some pattern (as I mentioned earlier not just the trend line but a pattern) I want to see my pattern in the RSI and the chart are rhymed and represent the same.
So not just the breakout happened in the same moment but the whole movement leading to the breakout is the same, that’s what I prefer to do. Since that moment I would expect to see a good continuation after the breakout.

Of course keeping a risk/reward ratio is extremely important, in such trading you want to be rewarded by more than you risk. So if you risk X amount of pips or money aim to take 2X or more in your profits and that’s what we call as statistical trading.
Here’s a Tip:
Before you just make yourself a pattern try to verify that you have a beginning of a downtrend and you do that by creating lower highs, lower lows. This is a very potential beginning of downtrend (If you want to learn more about this price action you can watch my webinar here).
So this is how I love to work with my RSI when I do look for its verification. My favorite indicator is the MACD and RSI is my second preferred indicator for these kind of purposes (that is for divergences and verification trading).
Watch the Video of RSI Indicator – Trading Guide & Tutorial
I invite you to join me in my live trading rooms, on daily basis, and improve your trading with us.
Also you can get one of my strategies free of charge. You will find all the details here
Thank you for your time reading this article.
To your success,
Vladimir Ribakov


Thanks alot , I appreciate you and your group