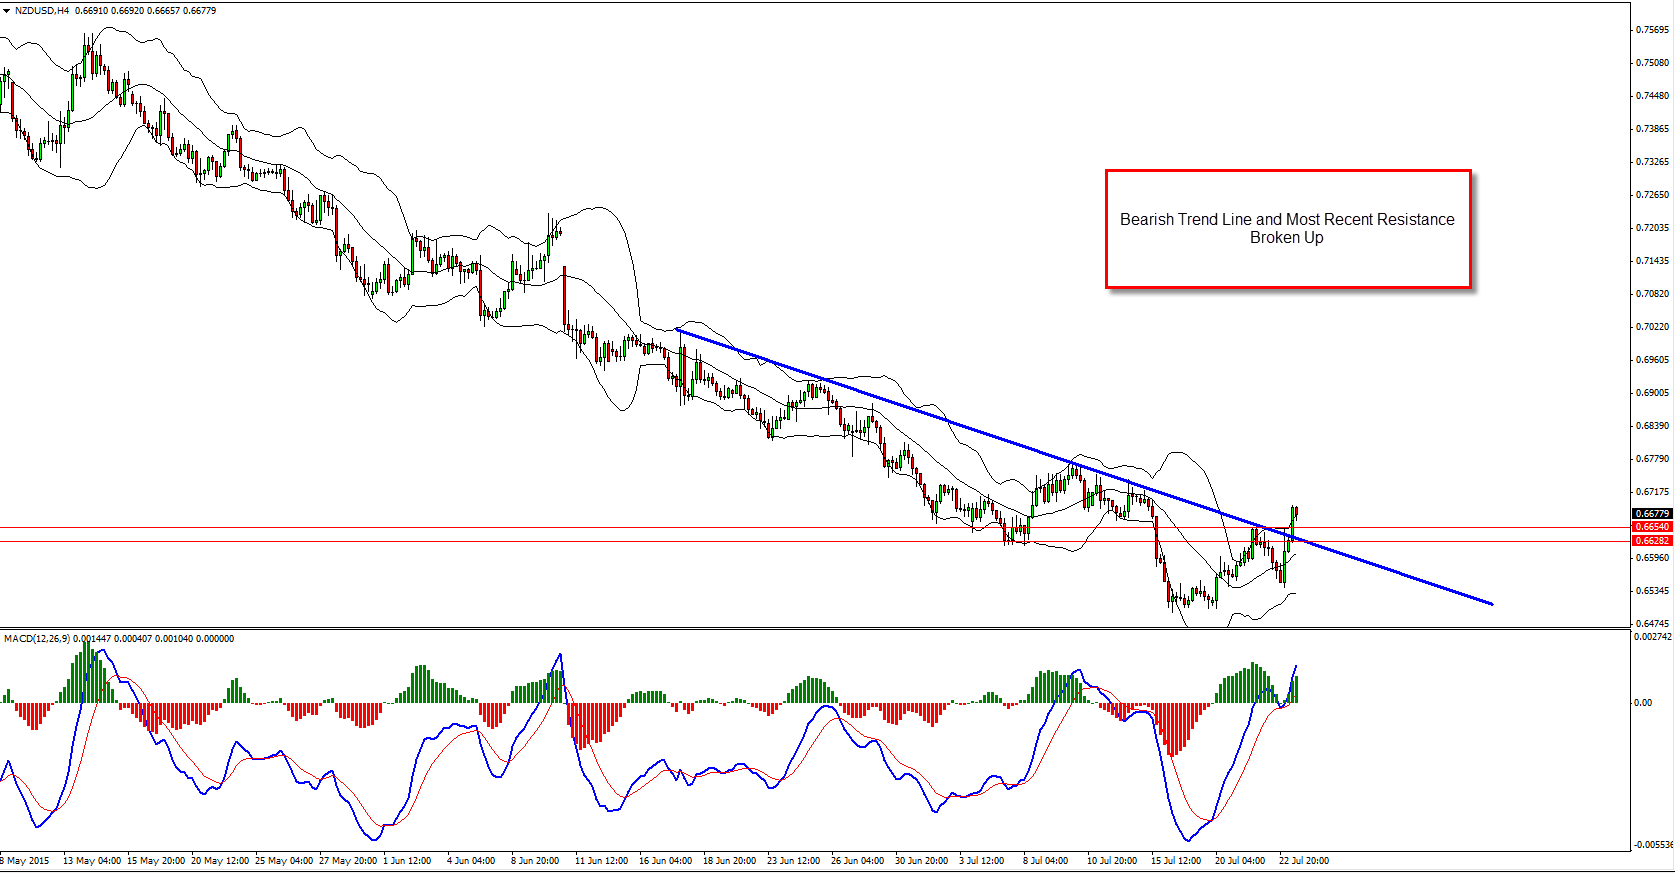
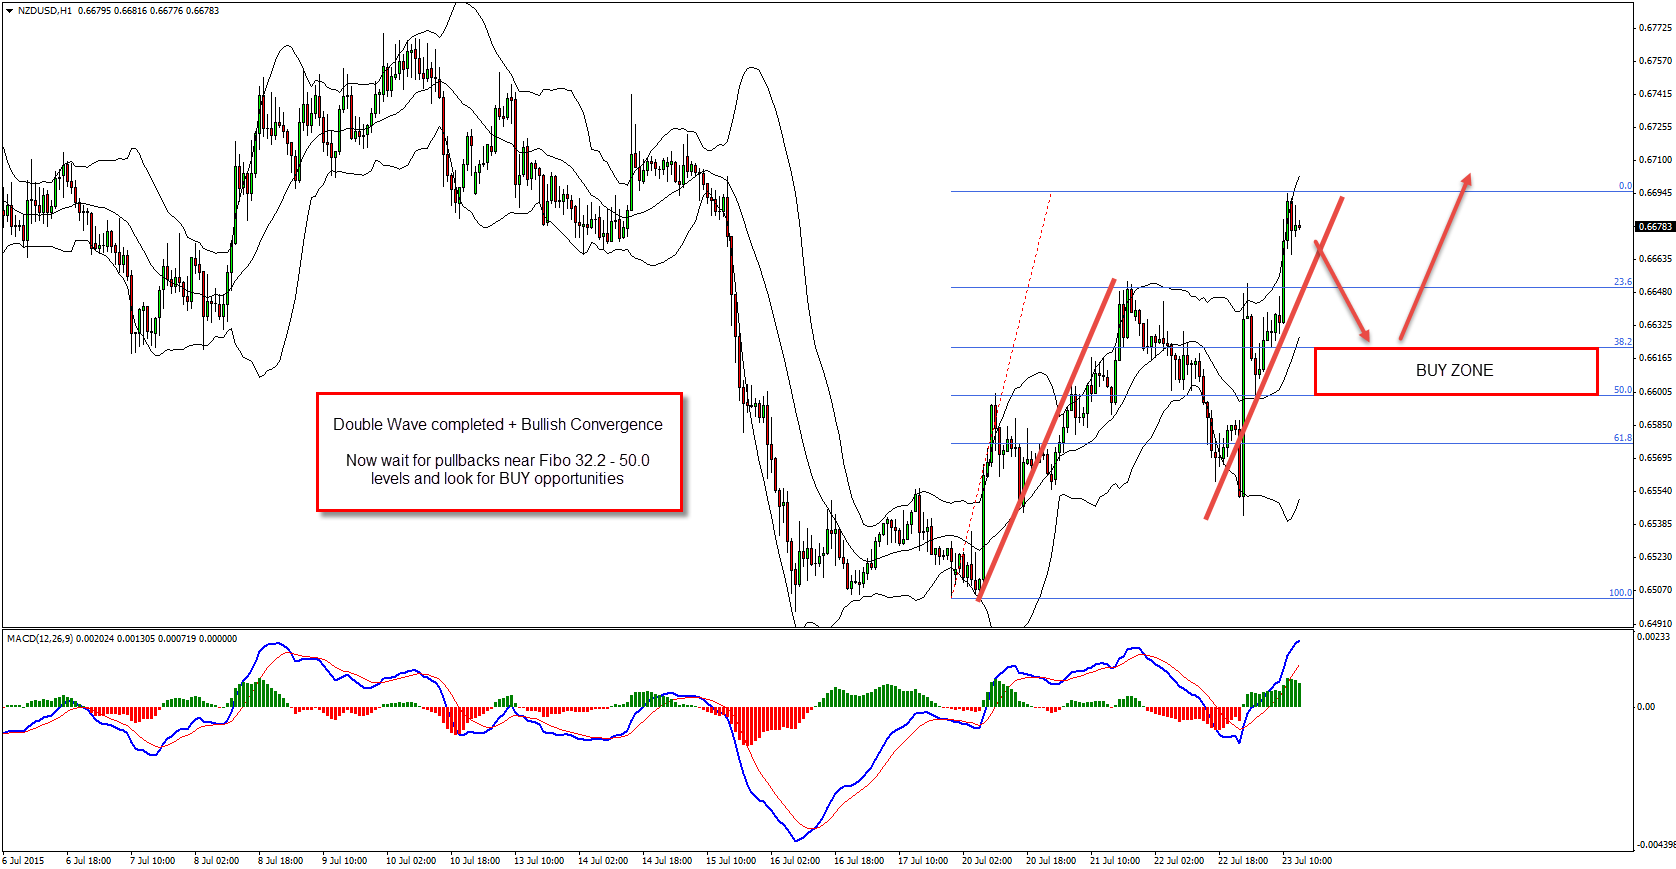
Kiwi’s been going south for some time now but i think it might have found a bottom at least for now. The H4 chart bearish trend line and most recent resistance zone have been breached up. There is also bullish convergence and double wave duplication on the H1 chart. Ideally we want the pair to correct itself back to the 38.2 – 50.0 Fibonacci zone where we can look for buy opportunities. Watch out for double wave correction down, ideally accompanied with bullish hidden divergence.
Technical Analysis:
H4 – bearish trend line broken along with resistance zone
H1 – bullish convergence, double wave cycle completed
Entry:
H1 – Follow the 38.2 – 50.0 Fibonacci zone and look for buy opportunities after a double wave correction and/or bullish hidden divergence.
Target 1 – 0.6726
Target 2 – 0.6831
Target 3 – 0.6985
Stop Loss – below last low created
Yours,
Vlad
Hi Traders! Arvinth here from the Home Trader Club team. The weekly summary and, review of July…
U.S. stock indexes hit multi-week lows on Thursday, as concerns over heavy AI spending resurfaced…
Hi Traders! GBPUSD short term forecast and technical analysis is here. We do our analysis…
Hi Traders! Ethereum short term forecast follow-up and update is here. On May 26th, 2026…
Hi Traders! GBPAUD short term forecast and technical analysis is here. We do our analysis…
Hi Traders! USDCHF short term forecast update and follow up is here. On May 20th,…