Hi Traders! GBPAUD short and mid term forecast follow up and update is here. On February 23rd I shared this “Technical Analysis – GBPAUD Short And Mid Term Forecast” post in our blog. In this post, let’s do a recap of this setup and see how it has developed now. If you would like to learn more about the way we trade and the technical analysis we use then check out the Traders Academy Club. Spoiler alert – free memberships are available!
My Idea
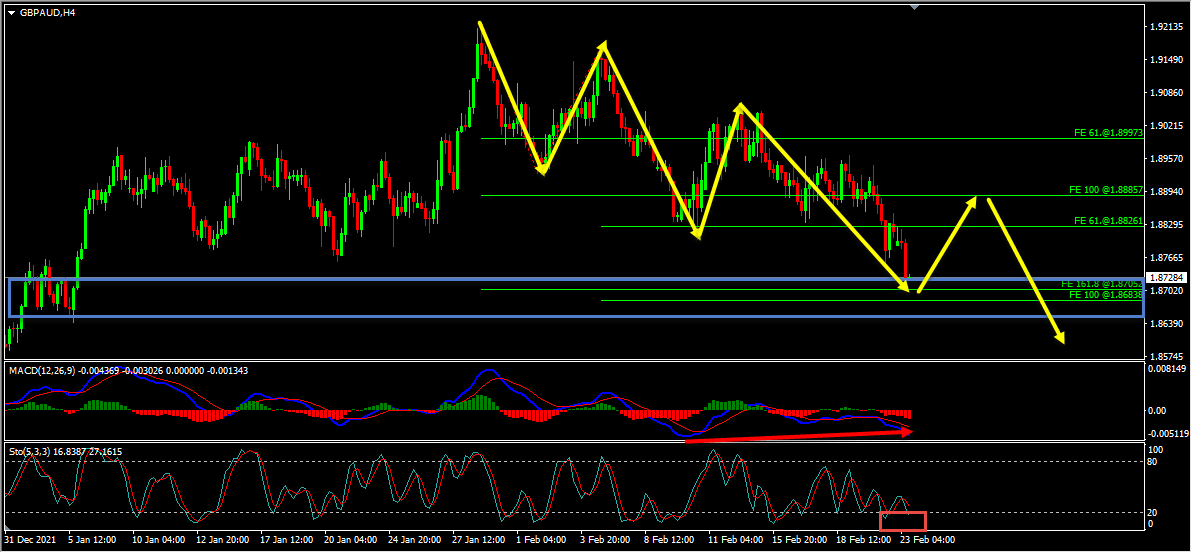
Looking at the H4 chart, we could see that the price which was moving lower has created a bearish trend pattern in the form of three lower highs, lower lows which we may consider as evidence of bearish pressure. Generally, after a bearish trend pattern, we may expect corrections and then further continuation lower. Also, while measuring the first two waves of this bearish trend pattern using the Fibonacci expansion tool we have a key support zone that has formed based on the 161.8%(1.87052) Fibonacci expansion level of the first wave and the 100%(1.86838) Fibonacci expansion level of the second wave. Price has currently reached this key support zone and in addition to this, we have a potential bullish divergence that has formed between the first low that has formed at 1.88010 and the second current low that has formed at 1.87047 based on the MACD indicator which we may consider as evidence of bullish pressure. Also, based on the Stochastic Oscillator we could see that the price has reached its extreme which we may consider as another evidence favoring the short term bullish view. So based on all this, my short expectation is bullish and my mid term expectation is bearish here.
In this pair based on the above-mentioned analysis my short term view was bullish and my mid term view was bearish. The price action followed my analysis exactly as I expected it to here, the short term bullish move happened from the key support zone and delivered 160+ pips move. Then the price moved lower further as I expected it to and has delivered 420+ pips move so far.
You can see this move clearly on the H1 chart below.
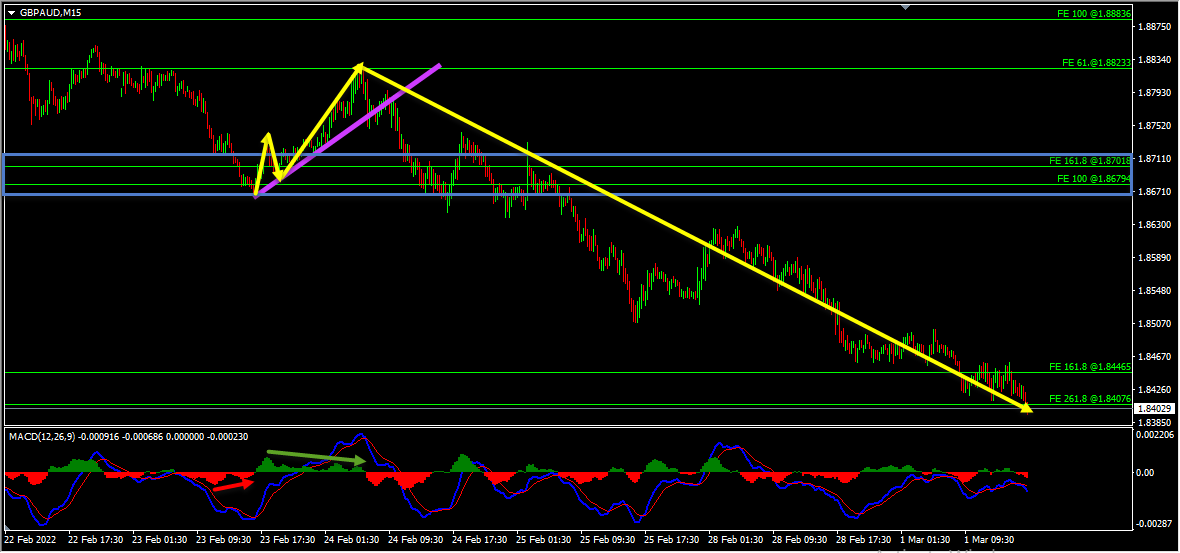
On the M15 chart, the market provided us with various facts supporting the short term bullish view and mid term bearish view. The price which was moving lower reached the key support zone with the price creating a bullish divergence between the first low that has formed at 1.87156 and the second low that has formed at 1.86653 based on the MACD indicator which we may consider as a fact provided by the market supporting the short term bullish view. The price then moved higher and delivered around 160+ pips move until it was blocked by a bearish divergence. The price then moved lower and broke below the most recent uptrend line which we may consider as facts provided by the market supporting the mid term bearish view. Then as you can see in the image below how the price moved lower further and provided a fantastic move to the downside.
(Note: You can learn about a Killer Forex Strategy “Double Trend Line Principle” here)
As traders we always have two choices, the first one is to fall in love with our analysis and try to convince the market and expect the price to move in the direction as per our wish. The second one is to follow the facts that the market provides us and make the right actions according to that. As you know the first option won’t help us and as you can see in the example above what happened when we followed the facts that the market hinted to us and took the right action according to that.
For similar trade ideas and much more I invite you to
Also, you can get one of our strategies free of charge. You will find all the details here
If you have any further questions, don’t hesitate to drop a comment below!
Happy Trading!
Arvinth Akash
Traders Academy Club Team
Hi Traders! Arvinth here from the Home Trader Club team. The weekly summary and, review of July…
European markets edged lower on Thursday following more overnight volatility in Asia’s tech-dominated indexes, while…
Hi Traders! EURGBP short term forecast and technical analysis is here. We do our analysis…
Hi Traders! Bitcoin short term forecast update and follow up is here. On May 7th,…
Hi Traders! AUDJPY short term forecast and technical analysis is here. We do our analysis…
Hi Traders! Oil short term forecast and technical analysis is here. We do our analysis…