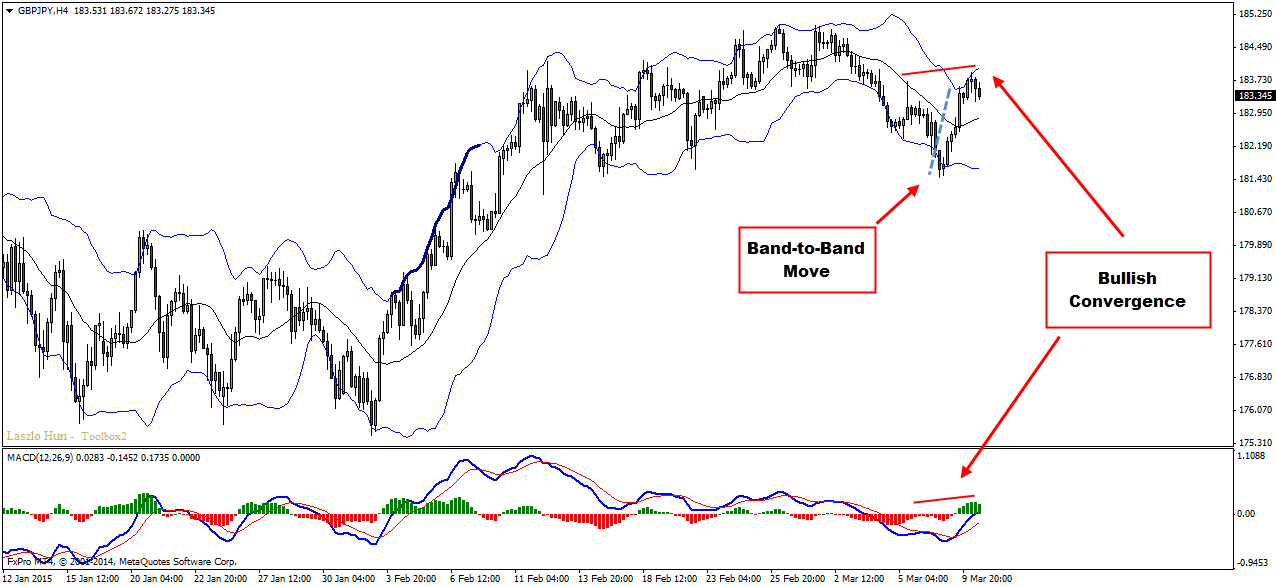
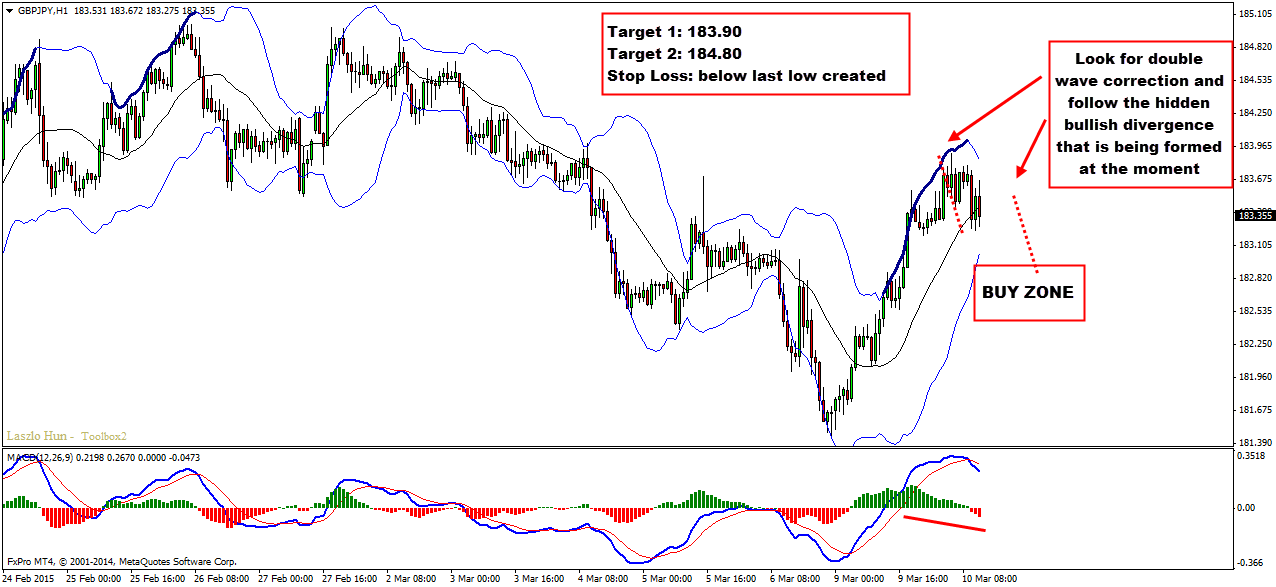
GBPJPY made a nice up move since yesterday and created a bullish convergence. Classical? For sure not but it is still convergence and it still made new highs so we should take into consideration. Also on the H4 chart we can see that there was a clear band-to-band move (bollinger bands). Basically the idea here is to join after we see a double wave correction on the lower time frames. So drop down to the H1 chart, which is also forming bullish hidden divergence, that gives us extra bullish confirmation, and wait for the duplication to complete. Than you can go for a buy.
Technical Overview:
H4 – Bullish Convergence, Band-to-Band Move
H1 – hidden divergence, potential wave duplication, 20+ candles ride on the bollinger bands
Entry:
H1 – Wait for the price to create that double wave correction down and go for a buy. You can confirm your trigger once the price is inside the duplicated wave zone and MACD’s histogram slope turns bullish. Ideally we want to see a bullish candle pattern as well.
Target 1: 183.90
Target 2: 184.80
Stop Loss: below last low created
Video Explanation:
Yours,
Vlad
Hi Traders! SP500 short term forecast update and follow up is here. On December 18th,…
Hi Traders! AUDNZD short term forecast and technical analysis is here. We do our analysis…
Hi Traders! USDJPY short term forecast update and follow up is here. On January 29th,…
Hi Traders! AUDCHF short term forecast and technical analysis is here. We do our analysis…
World markets rapidly reversed course on Monday after U.S. President Donald Trump said he will…
Hi Traders! Arvinth here from the Home Trader Club team. The weekly summary and, review of March…