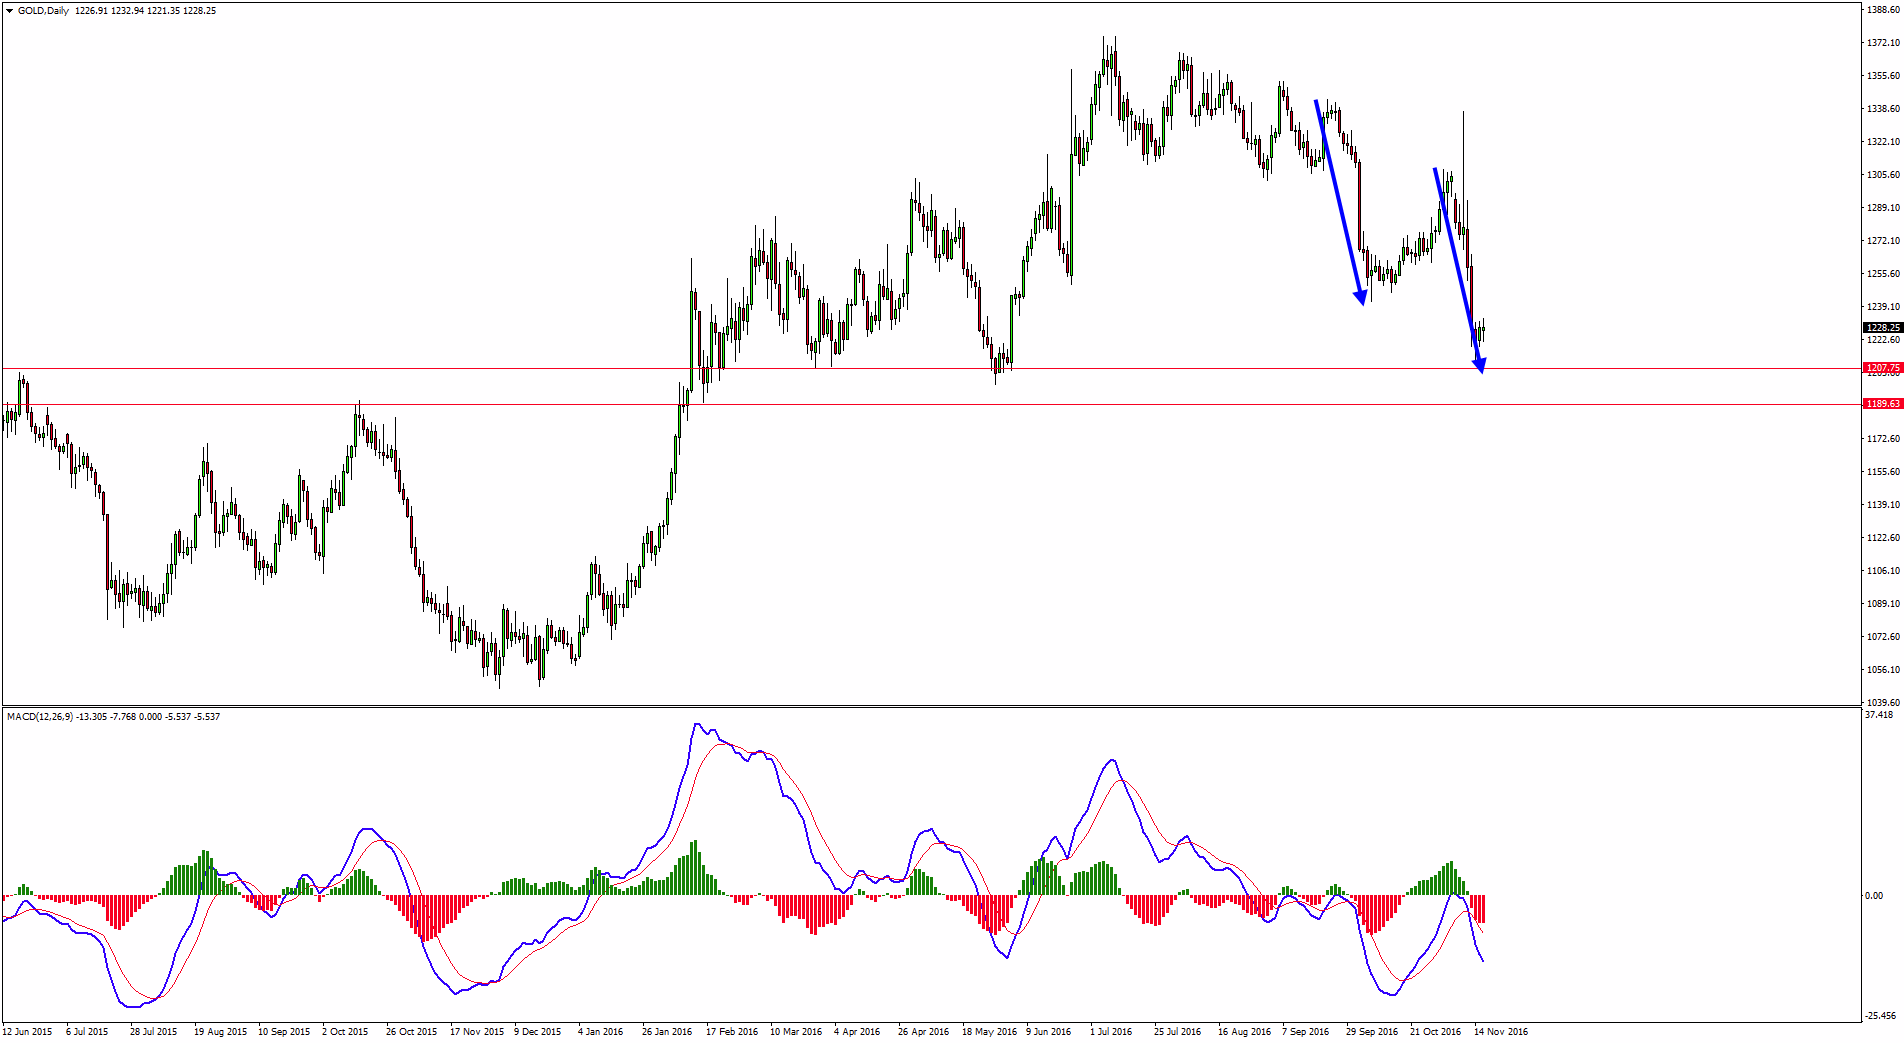
I’m expecting gold to push down one more time before we will see the bulls taking control. It all comes from the Daily chart where it seems that the commodities is about to complete a bearish double cycle (ignoring the spike).
To zone marked in the screenshot below is where we want to see the price first of all.
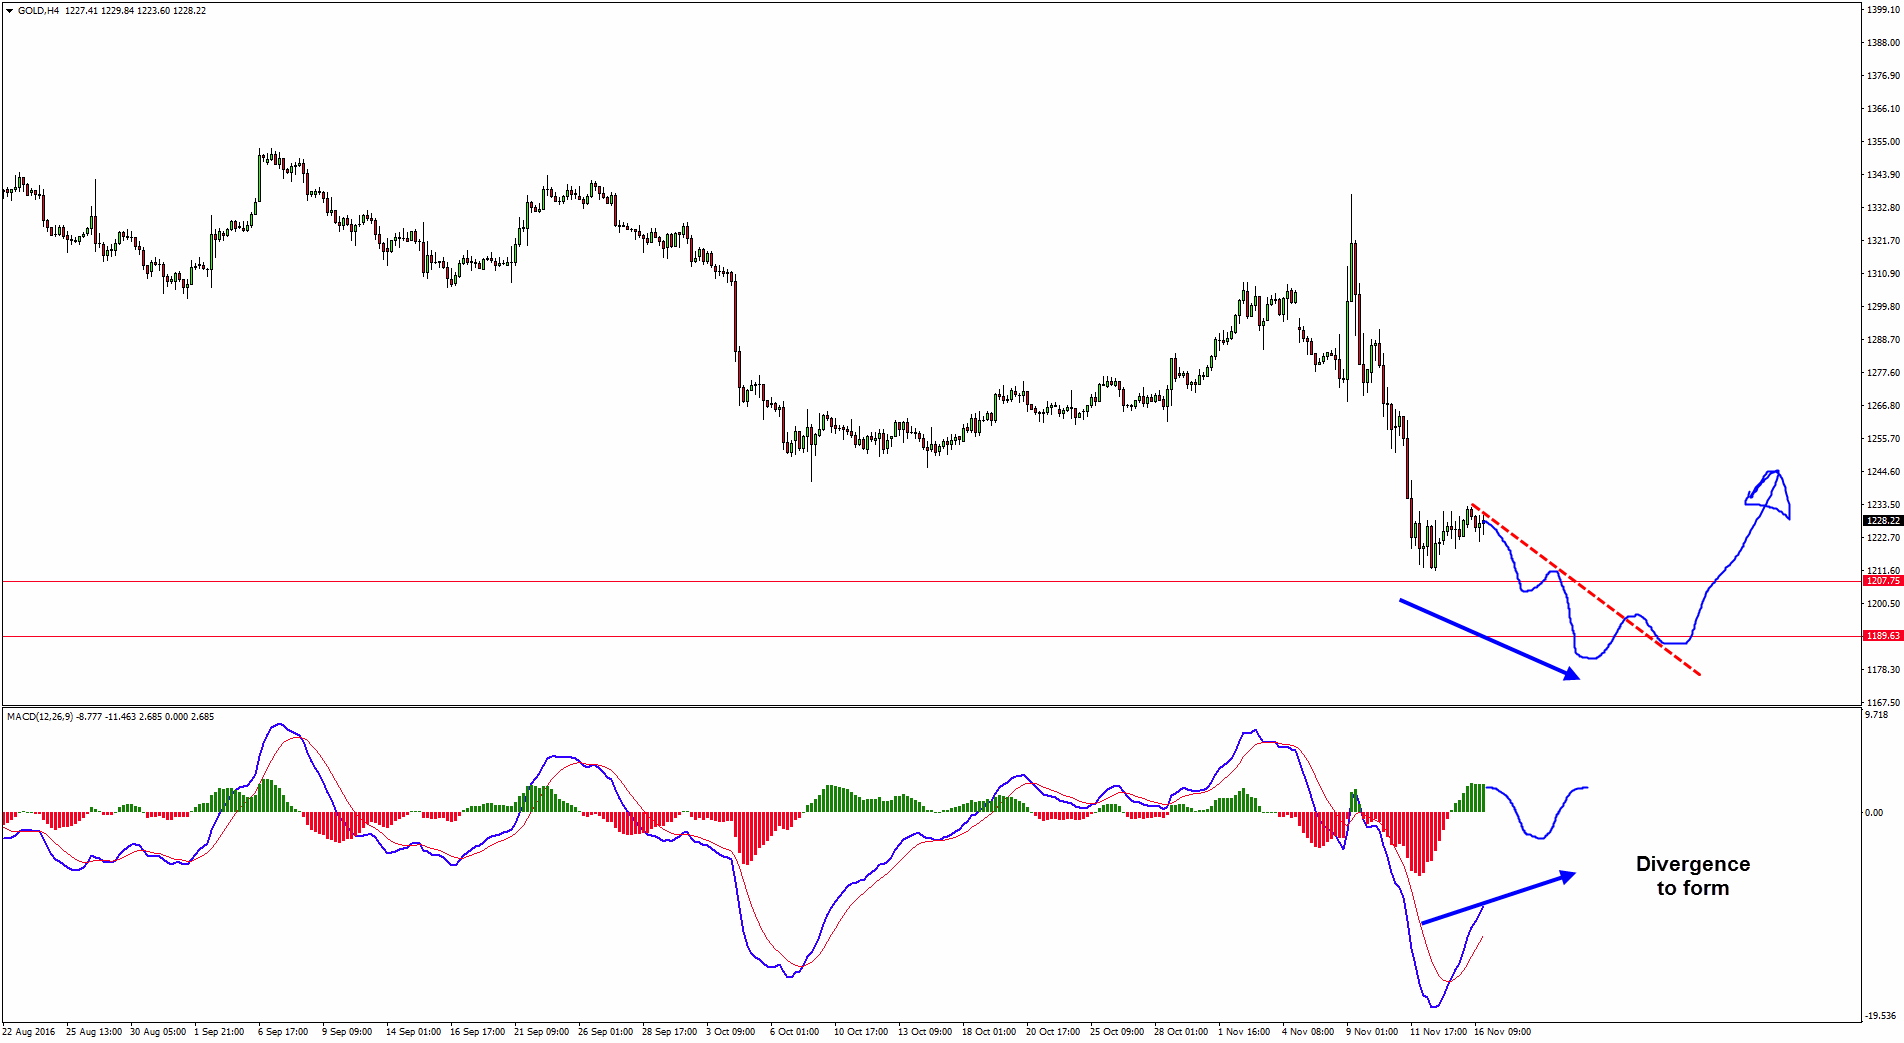
I expect to see something like that (as marked in the image below). The last push down should form divergence on the H4 chart as well. The most conservative way to join would be to wait for the breakout of the most recent trend line, small correction and then go long.
Target 1 – 1228.00.
Target 2 – 1250.00.
Stop Loss – below last low created.
Yours,
Vladimir
Hi Traders! Arvinth here from the Home Trader Club team. The weekly summary and, review of March…
Europe’s bonds will struggle to bounce back from a sharp selloff triggered by the war…
Hi Traders! GBPUSD short term forecast and technical analysis is here. We do our analysis…
Hi Traders! SP500 short term forecast update and follow up is here. On December 18th,…
Hi Traders! AUDNZD short term forecast and technical analysis is here. We do our analysis…
Hi Traders! USDJPY short term forecast update and follow up is here. On January 29th,…
View Comments
Trust me, you does an excellent job.
Hi Vlad, thank you so much for the screenshots, really helps a lot.
Thanks for the quick update Vlad