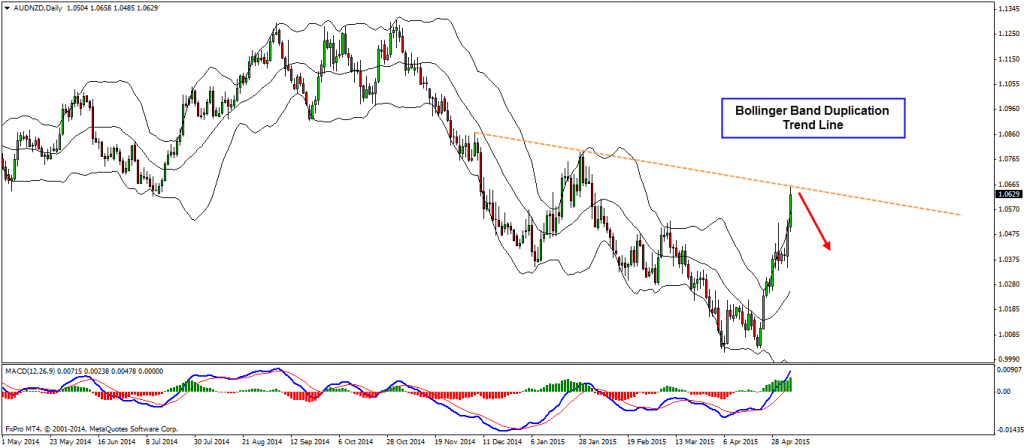
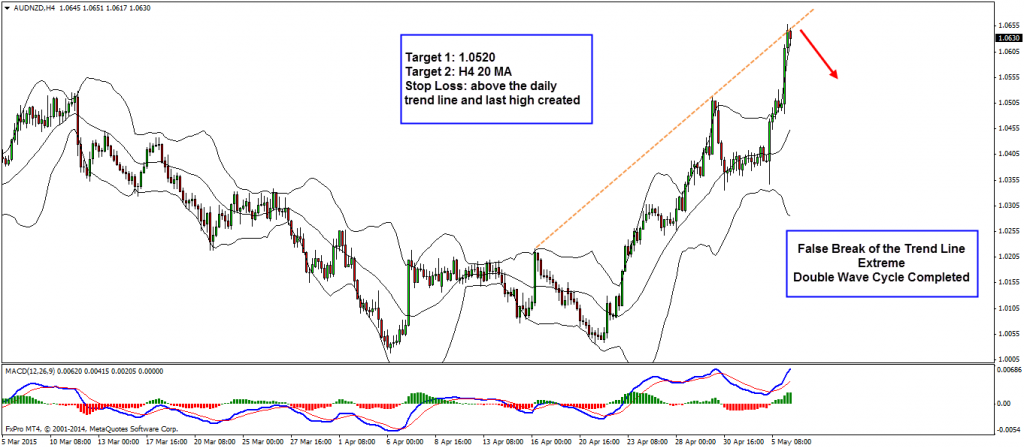
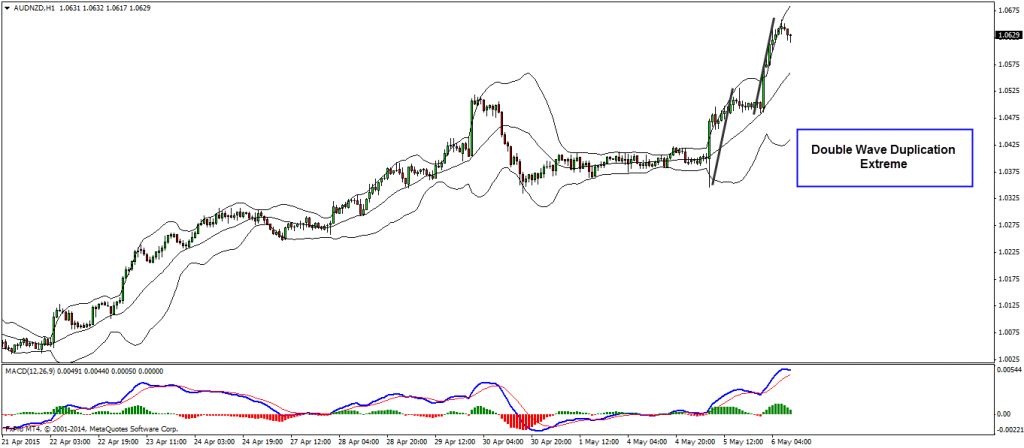
As we are getting closer to NFP we should be extra careful. Today we have ADP scheduled in a few hours as well. As explained in the daily market forecast video i think one of the best trading opportunities comes from the AUDNZD. The pair is making bollinger band duplication on the daily chart, there is also a trend line meeting the price a but higher. On the H4 chart it looks like we have a false break of the other trend line that comes from the highs. We are in extreme already on both the H4 chart and the H1 charts. There is also double wave cycle on the one chart which completes again near the trend line. So it all comes to the same idea and I think this is a great place for a sell.
Technical Analysis Overview:
D1 – trend line, bollinger band duplication
H4 – double wave completed, false break of the up trend line from the highs in progress, extreme
H1 – extreme, double wave cycle completed
Entry:
H4 – One way to enter would be if the H4 chart confirms a false break of the trend line. This will provide great risk:reward ratio for our trade.
Target 1: 1.0520
Target 2: H4 20 MA
Stop Loss: above the daily trend line and last high created
Video Explanation:
Yours,
Vladimir
Europe’s bonds will struggle to bounce back from a sharp selloff triggered by the war…
Hi Traders! GBPUSD short term forecast and technical analysis is here. We do our analysis…
Hi Traders! SP500 short term forecast update and follow up is here. On December 18th,…
Hi Traders! AUDNZD short term forecast and technical analysis is here. We do our analysis…
Hi Traders! USDJPY short term forecast update and follow up is here. On January 29th,…
Hi Traders! AUDCHF short term forecast and technical analysis is here. We do our analysis…