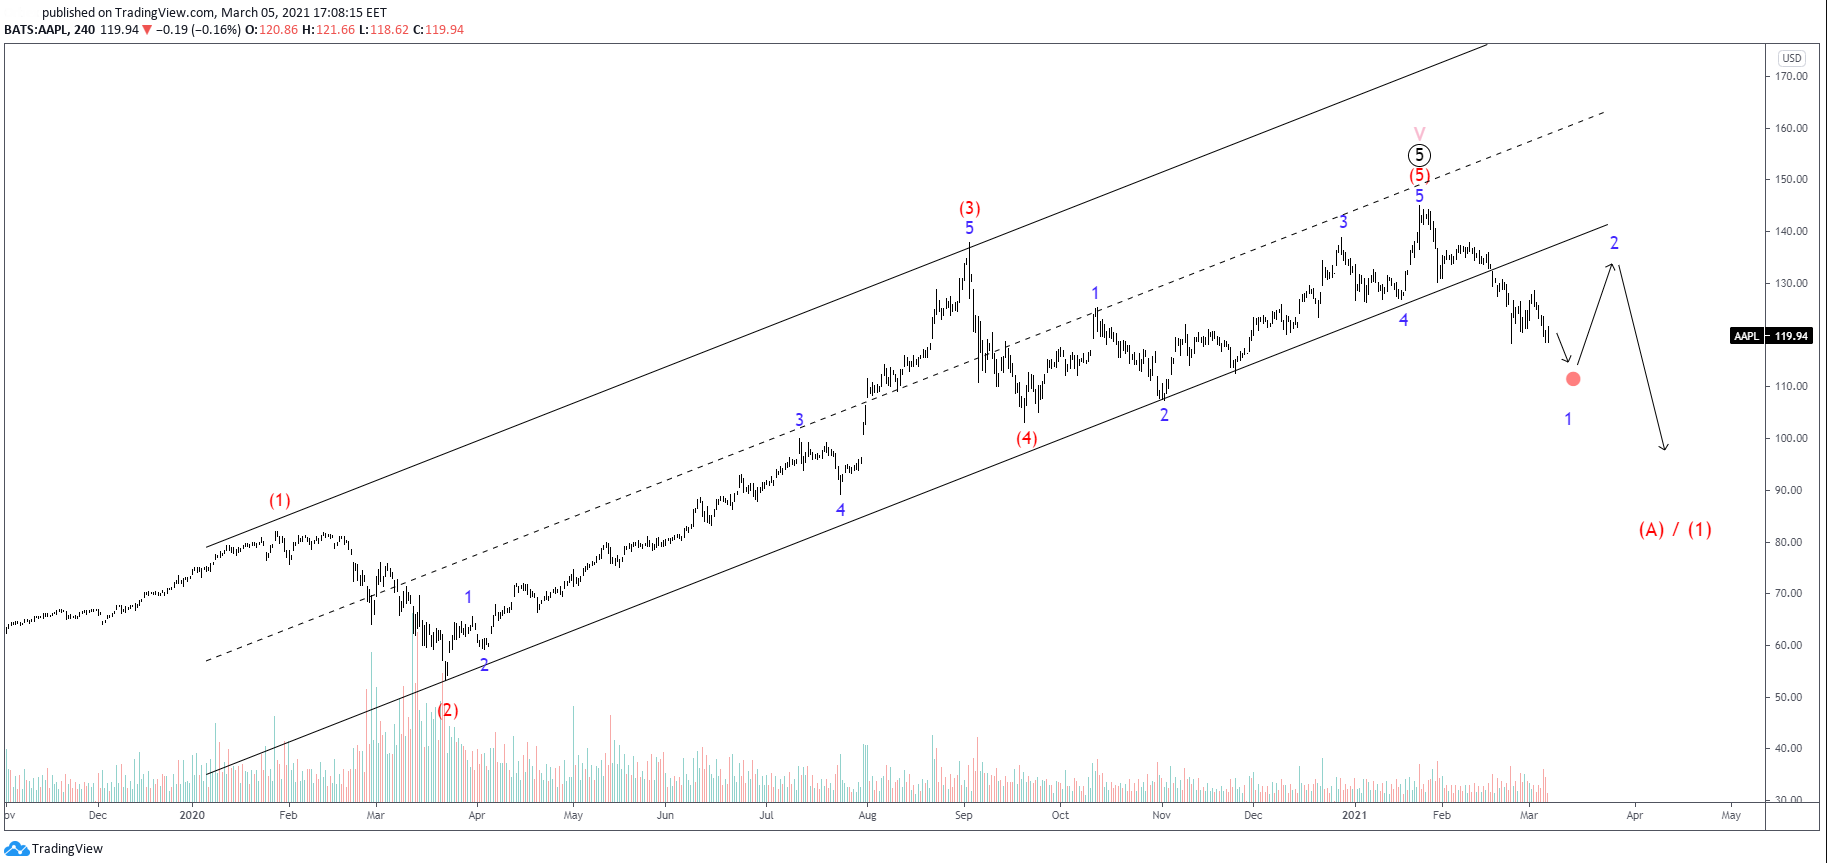
APPLE’s recent decline in prices looks impulsive so far, which suggest that black ⓥ could complete soon by registering a local low.
The chart above is indicative of a bearish leg, however, how long this can last will depend on whether the structure from red (3) is a running or an expanding flat pattern.
A flat pattern is a 3-3-5 (A-B-C) corrective pattern. Whether it is a regular or an irregular (running flat or expanding flat) pattern depends on waves B and C. A running flat would see prices correcting to anywhere between $103.15 and $111.23. On the other hand, an expanding flat would see prices take a dip down to $82; anywhere between $103.15 and $82.
The completion of the correction in red (4) would suggest that prices have yet another bullish leg up. It could be any motive wave; an impulse or a motive wave such as an ending diagonal. How the 5th final wave will end will depend on whether one or the other pattern forms. However, as a guideline, we can expect the 0.618 extension of waves (3)-(4) at $164 to make a good top.
Another count suggests that prices could continue lower than the low we can expect in an expanded flat scenario. So, it would only come up on the surface should we break $82.
The alternative structure sees an end of the primary degree impulse in pink V, at $145. The particular count assumes that the correction in red (4) ended at $102, and the upside to the top registered as a red (5).
In such scenario the decline in what-is-seen-as blue 1, can be expected to be the beginning of an intermediate impulse or correction, both of which would be part of the higher primary degree bearish leg.
In case of an intermediate impulse, then the pattern will likely end in a primary degree correction. In case of an intermediated correction, then the pattern will likely end in a primary degree complex correction. In either case, the prices of APLLE could reach a price as low as $58 or even $33 (unlikely) per share.
About the Author
Stavros is an licensed Forex professional, currently heading the investment research team at a reputable broker. He has demonstrated history in proprietary trading, Elliott Wave analysis and educational content writing. He is seen writing in the best sites for traders.
You can follow Stavros on Twitter and Linkedin here: twitter.com/StavrosTousios & linkedin.com/in/stavrostousios/
Hi Traders! Arvinth here from the Home Trader Club team. The weekly summary and, review of April…
Stocks and bonds fell as oil surged anew, with President Donald Trump dashing optimism that the war in…
Hi Traders! GBPCAD short term forecast and technical analysis is here. We do our analysis…
Hi Traders! AUDJPY short term forecast and technical analysis is here. We do our analysis…
Hi Traders! EURJPY short term forecast update and follow up is here. On February 3rd,…
Hi Traders! NASDAQ short term forecast and technical analysis is here. We do our analysis…