GBPUSD had a nice break above its current resistance level of 1.5305.
On the H4, it clearly closed above the line, which is a bullish sign for us, and so we need to prepare to buy it.
From now on we are looking for pullbacks, and every pullback would be a buy opportunity, AS LONG AS it holds above the 1.53 resistance level.
By pullbacks I mean a retrace back towards the 1.53 level, without crossing it down, on any time frame such as 15 minutes, 1 hour or 4 hours.
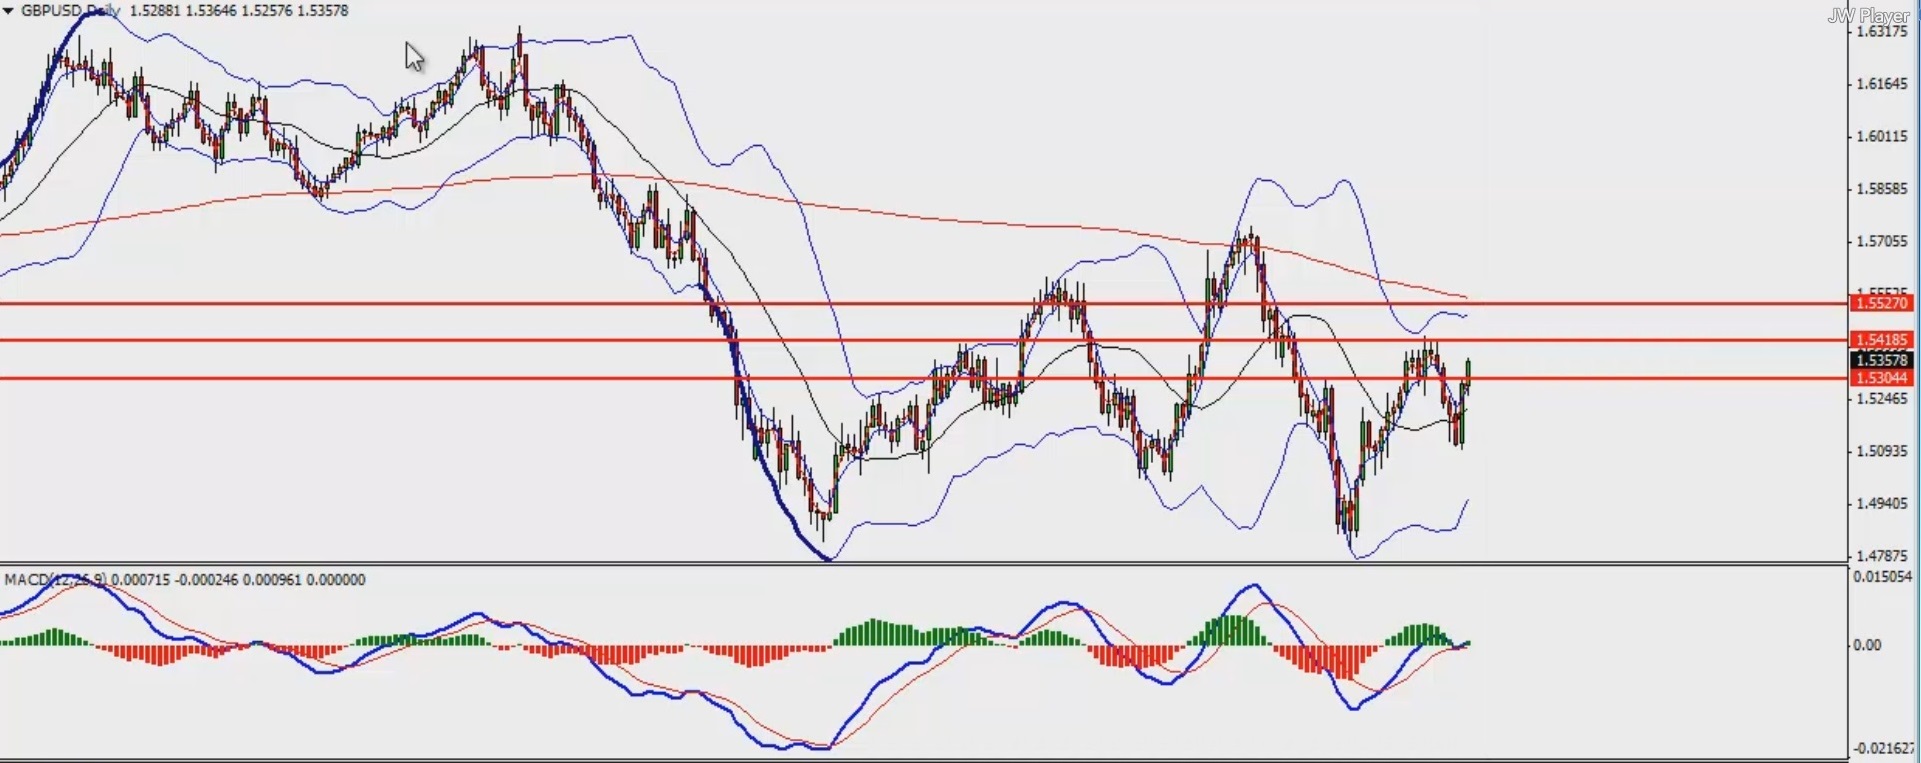
As for targets, the previous resistance level of 1.5420 is our first target. Second target is 1.5530. On the daily chart of GBPUSD this is the intersection of the upper Bollinger Band and the Moving Average 200, as can be seen in the screen shot.
So bottom line – we had a nice bullish break of the resistance, we are waiting for pullbacks to buy, as long as the GBPUSD holds above 1.53.
This analysis is taken from today’s Daily Market Forecast, which also includes trade opportunities on: EURUSD, GBPUSD, EURAUD, AUDNZD, USDCAD, AUDUSD and NATURAL GAS. For more details: Vladimir’s Markets Forecast
Europe’s bonds will struggle to bounce back from a sharp selloff triggered by the war…
Hi Traders! GBPUSD short term forecast and technical analysis is here. We do our analysis…
Hi Traders! SP500 short term forecast update and follow up is here. On December 18th,…
Hi Traders! AUDNZD short term forecast and technical analysis is here. We do our analysis…
Hi Traders! USDJPY short term forecast update and follow up is here. On January 29th,…
Hi Traders! AUDCHF short term forecast and technical analysis is here. We do our analysis…