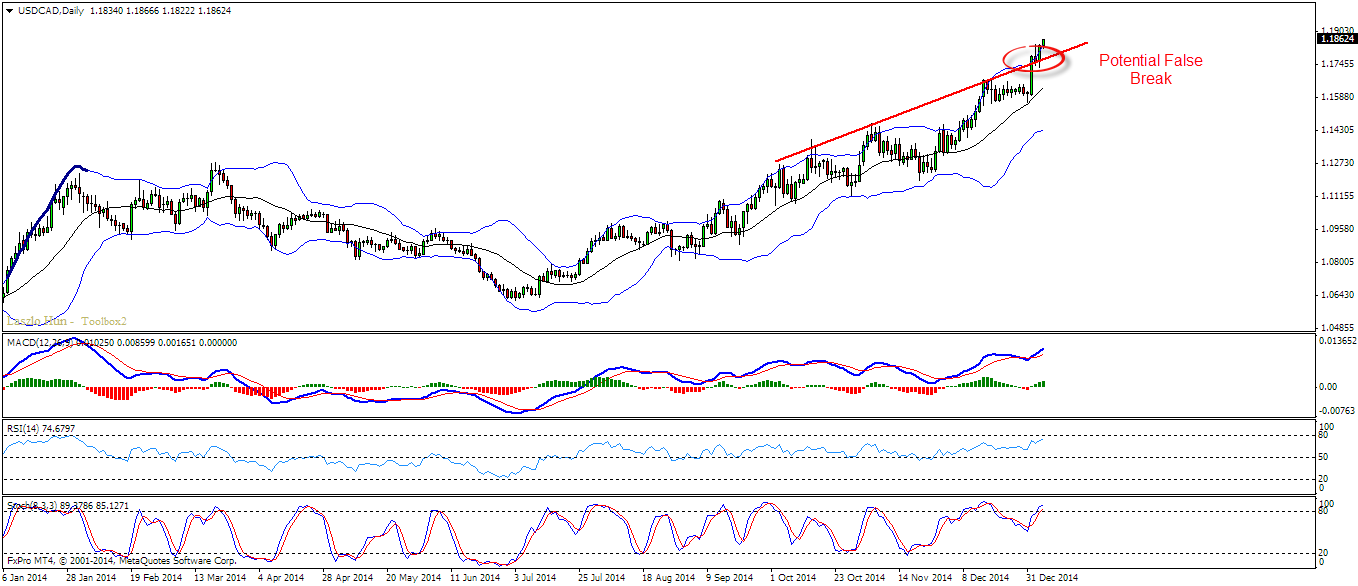
Pair continues to trade higher and I think it will reach a top soon around
the resistance area – 1.1850 – 1.1900. It is also acceptable if the pair reaches
1.2000. This is why we should be looking for sell opportunities
Technical Overview:
D1 – Top of the Bollinger Bands, breaking the up trend line from the tops – watch closely as it might turn into a false break
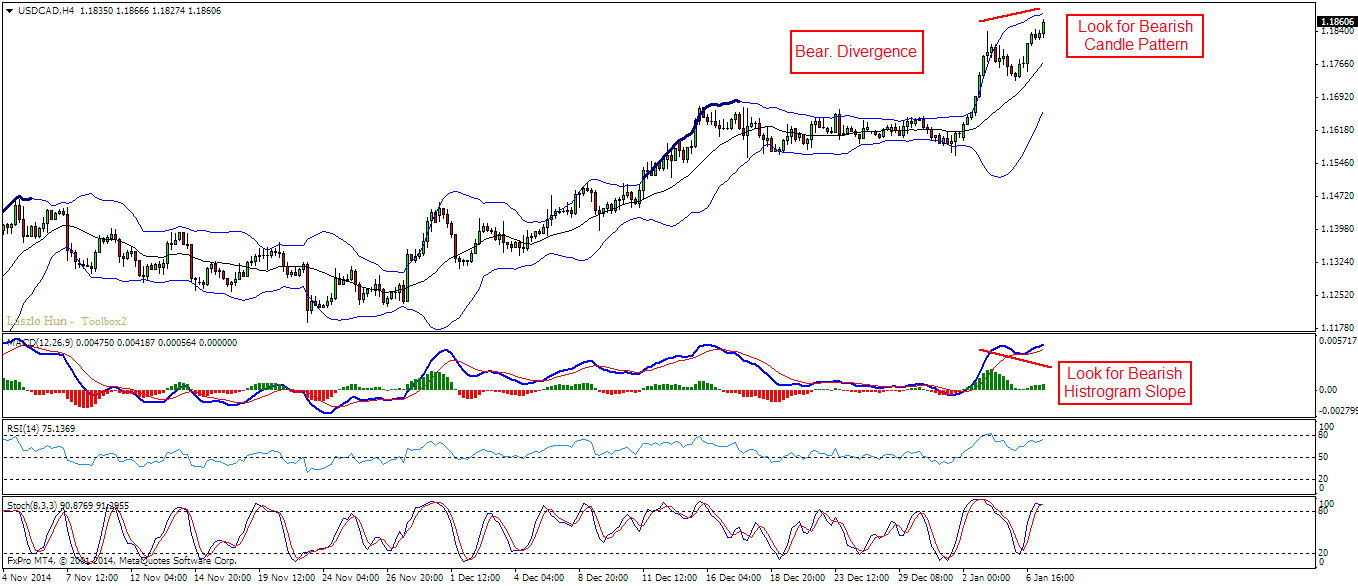
H4 – Bearish divergence is already there – our trigger is bearish candle and change in MACD histogram to the downside which will complete the divergence
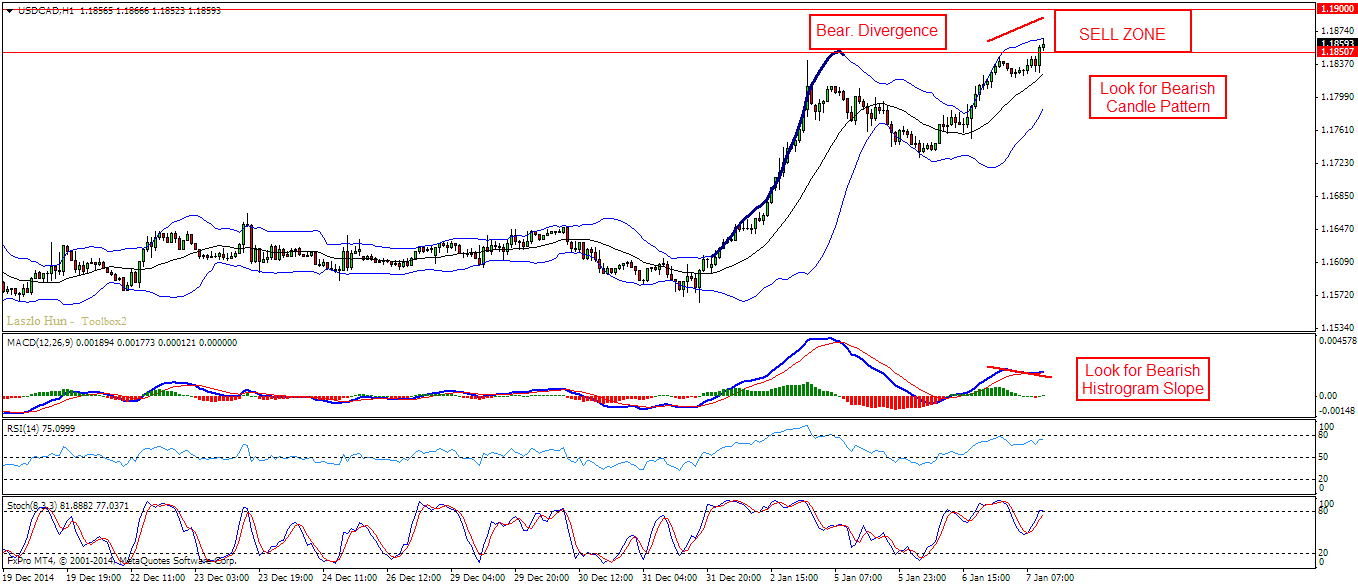
H1 – Also bearish divergence forming – same as with the H4 chart. Push higher around the mentioned resistance zone, bearish candle pattern and bearish
histogram on MACD
Entry:
The combination of both time frames (H4 + H1) would be a perfect sell trigger
Target 1: 20 MA on the H4 chart
Target 2: 1.1730
Watch the Video Explanation (extract from the daily market forecast video)
Have a profitable trading day!
Yours,
Vladimir
Hi Traders! Arvinth here from the Home Trader Club team. The weekly summary and, review of March…
Europe’s bonds will struggle to bounce back from a sharp selloff triggered by the war…
Hi Traders! GBPUSD short term forecast and technical analysis is here. We do our analysis…
Hi Traders! SP500 short term forecast update and follow up is here. On December 18th,…
Hi Traders! AUDNZD short term forecast and technical analysis is here. We do our analysis…
Hi Traders! USDJPY short term forecast update and follow up is here. On January 29th,…