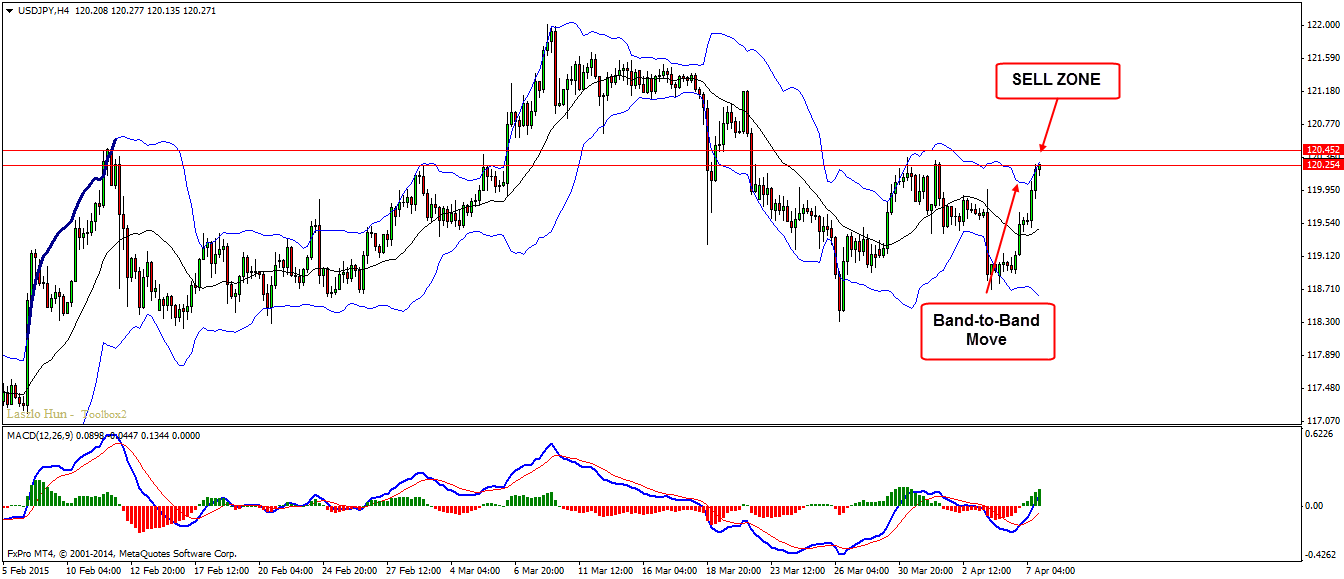
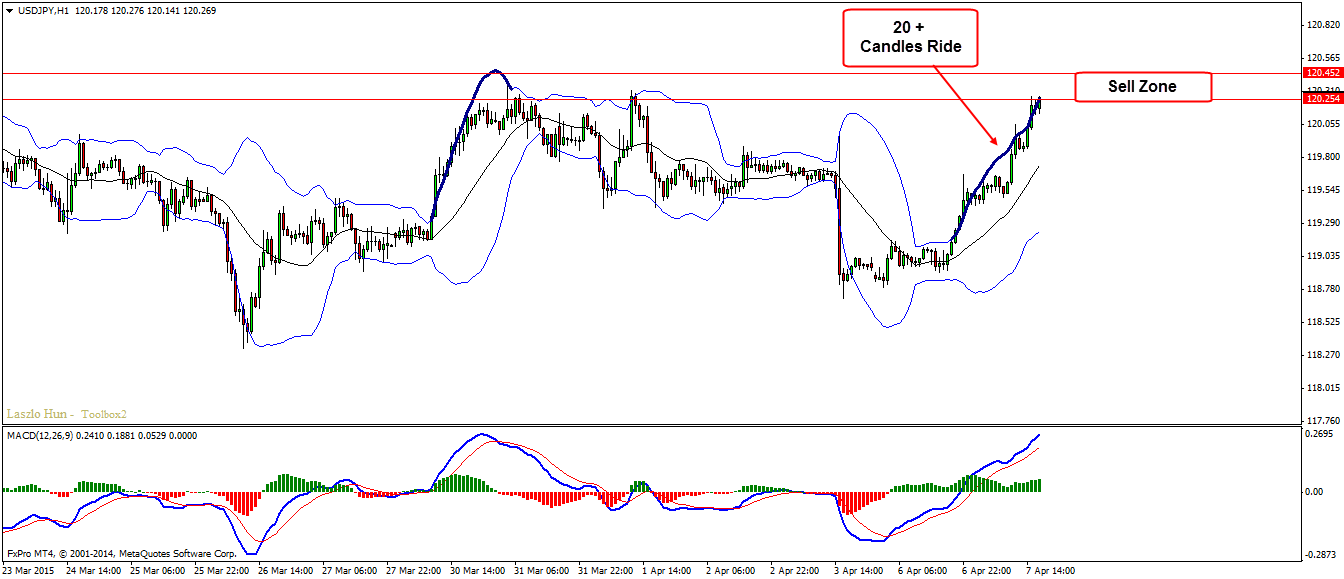
The USDJPY pair made a strong move up, creating band to band move on the H4 chart which is also a key resistance level. The plan is very simple we drop down to intraday time frame and look for a break of the most recent trend line in order to trigger the sell.
Technical Analysis:
H4 – band to band move on the bollinger bands, resistance
Entry:
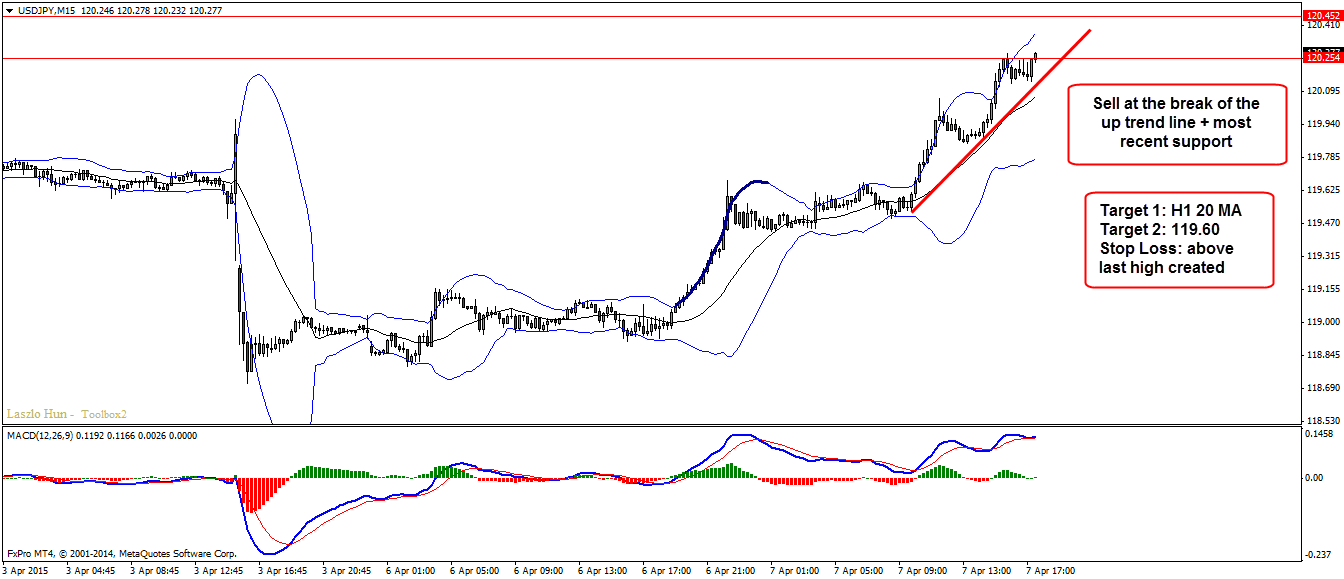
M15 – Look for break of the most recent up trend line and last support zone inside the SELL ZONE.
Target 1: H1 20 MA
Target 2: 119.60
Stop Loss: above last high created
Video Explanation:
Hi Traders! Arvinth here from the Home Trader Club team. The weekly summary and, review of March…
Europe’s bonds will struggle to bounce back from a sharp selloff triggered by the war…
Hi Traders! GBPUSD short term forecast and technical analysis is here. We do our analysis…
Hi Traders! SP500 short term forecast update and follow up is here. On December 18th,…
Hi Traders! AUDNZD short term forecast and technical analysis is here. We do our analysis…
Hi Traders! USDJPY short term forecast update and follow up is here. On January 29th,…