First of all it is important to mention and keep in mind that we are in a NFP week and we could expect the market to be rangy and make a lot of zig zags. Trade carefully, use smaller risk if you are not confident in the given setup or simply ignore it.
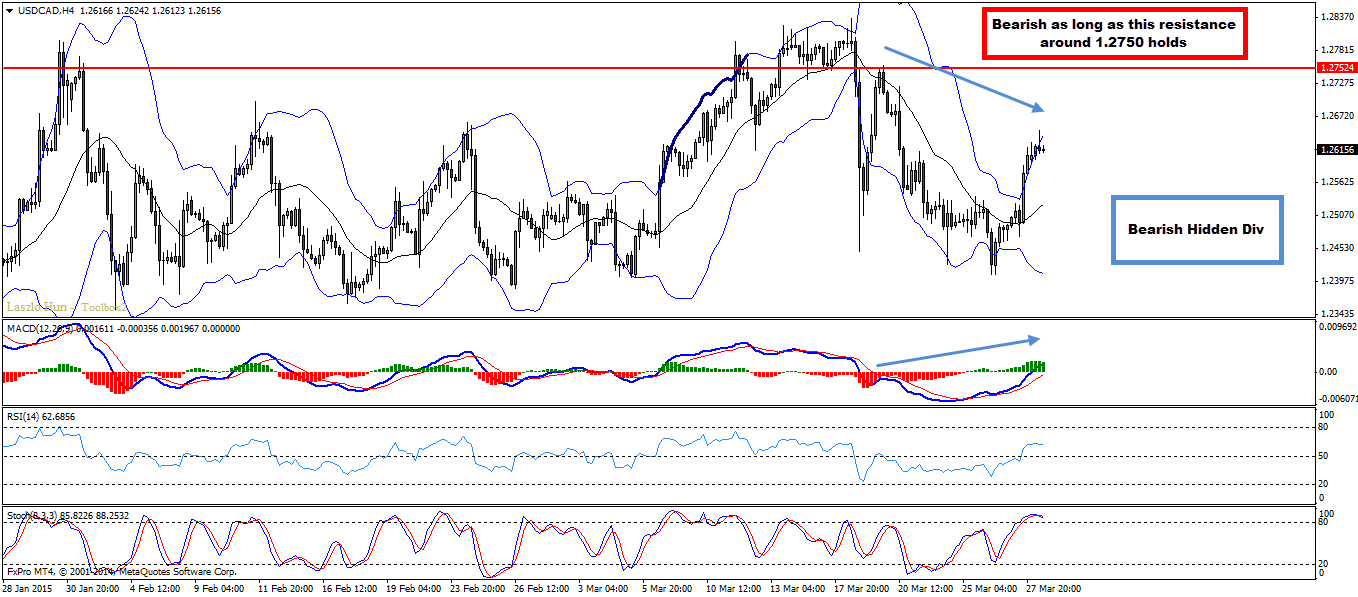
USDCAD looks pretty interesting in my point of view. As long as 1.2750 holds and price stays below it we can look for sell opportunities.
Technical Overview:
D1 – price is trading below 20 MA (even though we are seeing a spike up)
H4 – hidden bearish divergence
Entry:
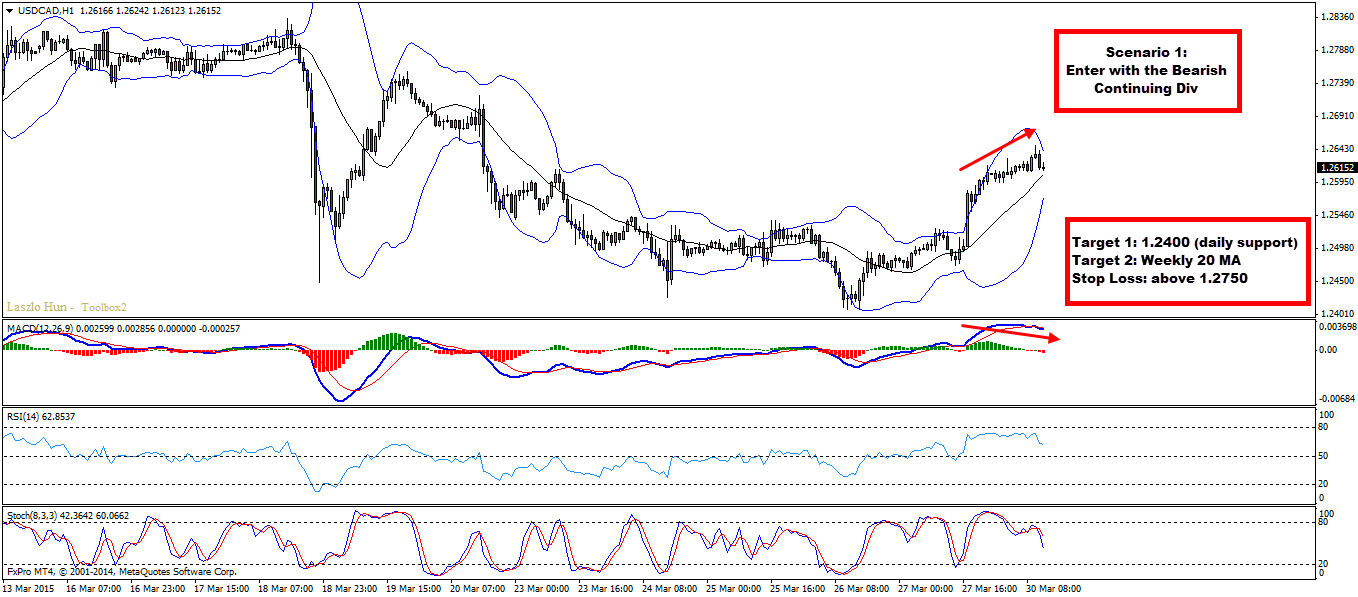
H1
Scenario 1 – Look for the continuing divergence on the H1 chart to complete and then go short.
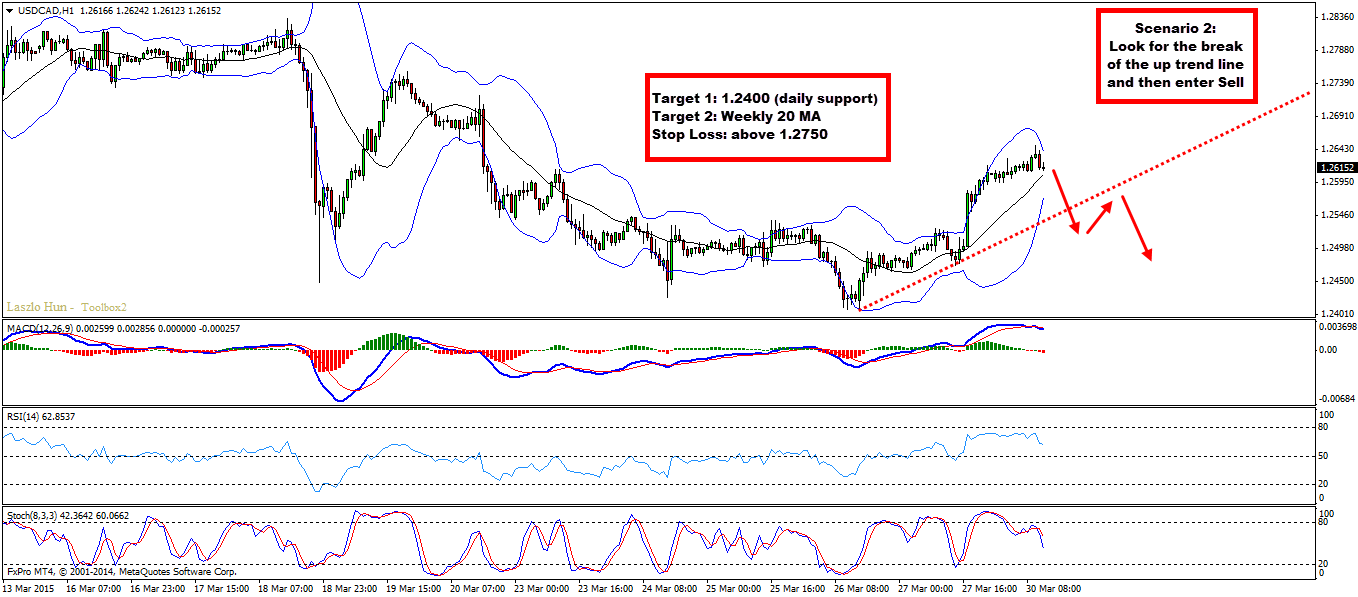
Scenario 2 – This is the more conservative entry. Simply follow the H1 up trend line, once broken you can go ahead and sell
Target 1: 1.2400 (daily support)
Target 2: Weekly 20 MA
Stop Loss: above 1.2750
Video Explanation:
Yours,
Vladimir
The financial markets are entering another potentially volatile trading week, with geopolitical developments likely to…
Hi Traders! Arvinth here from the Home Trader Club team. The weekly summary and, review of July…
U.S. stock indexes hit multi-week lows on Thursday, as concerns over heavy AI spending resurfaced…
Hi Traders! GBPUSD short term forecast and technical analysis is here. We do our analysis…
Hi Traders! Ethereum short term forecast follow-up and update is here. On May 26th, 2026…
Hi Traders! GBPAUD short term forecast and technical analysis is here. We do our analysis…