Hi Traders! USDSGD forecast follow up and update is here. On May 19th I shared this “USDSGD Forecast And Technical Analysis” post. In this post, let’s do a recap of this setup and see how it has developed now. If you would like to learn more about the way we trade and the technical analysis we use then check out the Traders Academy Club. Spoiler alert – free memberships are available!
Missed this trade?
Never miss a trade opportunity again! Join the Traders Academy Club
Now, let’s summarize the idea first:
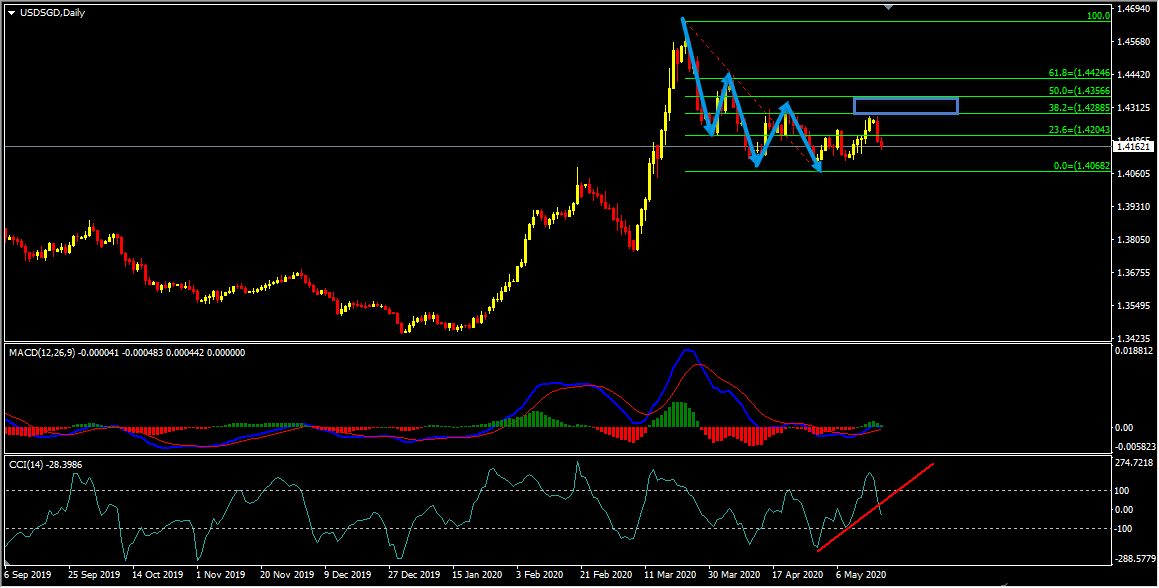
On the daily chart, the price has created a bearish trend pattern in the form of three lower highs, lower lows which we may consider as evidence of bearish pressure. Generally, after the bearish trend pattern, we may expect corrections to happen and then further continuation lower. Currently, it looks like the correction that we were looking for happened, the price reached the resistance zone formed by the 38.2% (1.42885) – 50%(1.43566) fibonacci retracement zones and is moving lower. In addition to this, we have an uptrend line breakout based on the CCI indicator which we may consider as another evidence of bearish pressure. We may now move down to lower timeframe and see if we can find evidences supporting this bearish view.
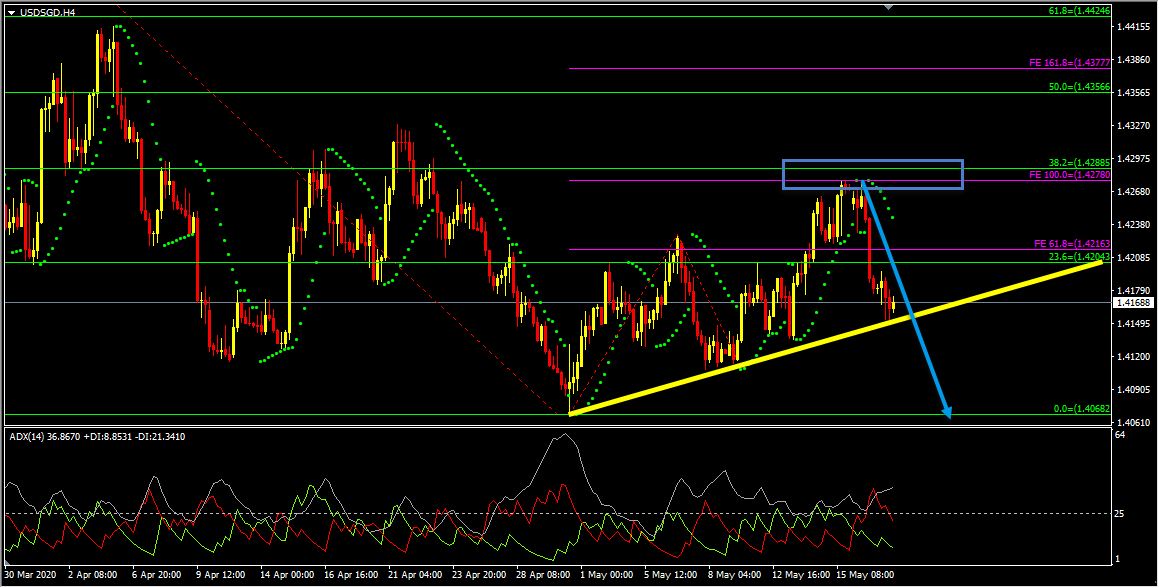
Looking at the H4 chart we could see that the correction happened in the form of two waves and while measuring the first wave, the 100% fibonacci expansion level of this first wave at 1.42780 coincides with the 38.2% fibonacci retracement level at 1.42885 which makes this area a key resistance zone for us. The price which was moving higher reached this zone, respected it and is currently moving lower. In addition to this based on the Parabolic Sar the dots are above the price which we may consider as evidence of bearish pressure. Also the ADX indicator gave bearish signal at the cross of -DI (red line) versus +DI (green line) and the main signal line (silver line) reads value over 25, we may consider this as another evidence of bearish pressure. So until this key resistance zone holds my view remains bearish here and a valid breakout below the most recent uptrend line would validate this bearish view.
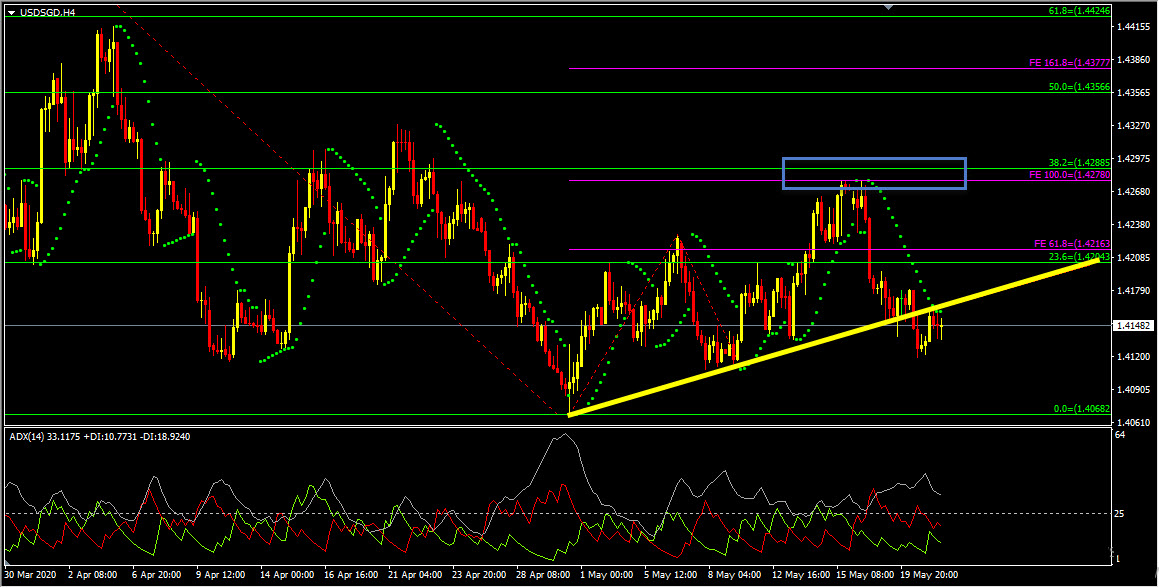
Based on the above-mentioned analysis my view is bearish here. On the H4 chart the price is moving perfectly as per my plan. The validation for this bearish view that is the most recent uptrend line breakout happened and currently it looks like the price has retested this breakout and is moving lower (you can see this clearly on the H1 chart below). The ADX indicator and the Parabolic Sar are still supporting the bearish view. As you can see on the screenshot below, on the ADX indicator the cross of -DI (red line) versus +DI (green line) is still holding and the main signal line (silver line) still reads value over 25. Also on the Parabolic Sar the dots are still above the price. So based on all this my view still remains bearish here.
For similar trade ideas and much more join the Traders Academy Club and get access to our complete watch list and trade report.
This is how the report looks like. A table with the hottest market opportunities, screenshot behind every pair and time frame (anything that is in blue inside the table is clickable and leads to a screenshot) + a summary in text format, kind of highlights. And of course Live Trading Room every single day.
If you have any further questions, don’t hesitate to drop a comment below!
To your success,
Vladimir Ribakov
Certified Financial Technician
Hi Traders! Oil short term forecast and technical analysis is here. We do our analysis…
The new trading week presents several high-probability opportunities across the forex and commodities markets. After…
Hi Traders! Arvinth here from the Home Trader Club team. The weekly summary and, review of July…
Hi Traders! UK100 short term forecast and technical analysis is here. We do our analysis…
Hi Traders! CADCHF short term forecast follow-up and update is here. On May 14th 2026…
Hi Traders! EURNZD short term forecast and technical analysis is here. We do our analysis…