The new trading week presents several high-probability opportunities across the forex and commodities markets. After last week’s price action respected many of the technical levels we discussed, the focus now shifts toward whether these markets can complete their corrective structures before the next major impulsive move.
This week’s analysis covers EUR/USD, GBP/USD, Gold (XAU/USD), and GBP/JPY, where multiple timeframes continue to align with strong technical signals including MACD divergence, trendline resistance, supply zones, and volume profile levels.
As always, remember that trading is about probabilities—not predictions. Our goal is to identify high-quality areas where risk and reward remain favorable.
We have partnered with AvaTrade, one of the industry’s leading regulated brokers.
When you open and trade with AvaTrade through our partnership, you receive:
If you’re looking to accelerate your trading journey while enjoying premium education, this partnership gives you everything you need under one roof.
If you already have account with them, still follow this link to open separate account with separate email. Once you did that, contact me with the telegram link below and we will give you the access.
Telegram Channel: https://t.me/vladimirribakovtradingchannel
Don’t forget to Like, Comment, and Subscribe for more weekly plans and real-time insights.
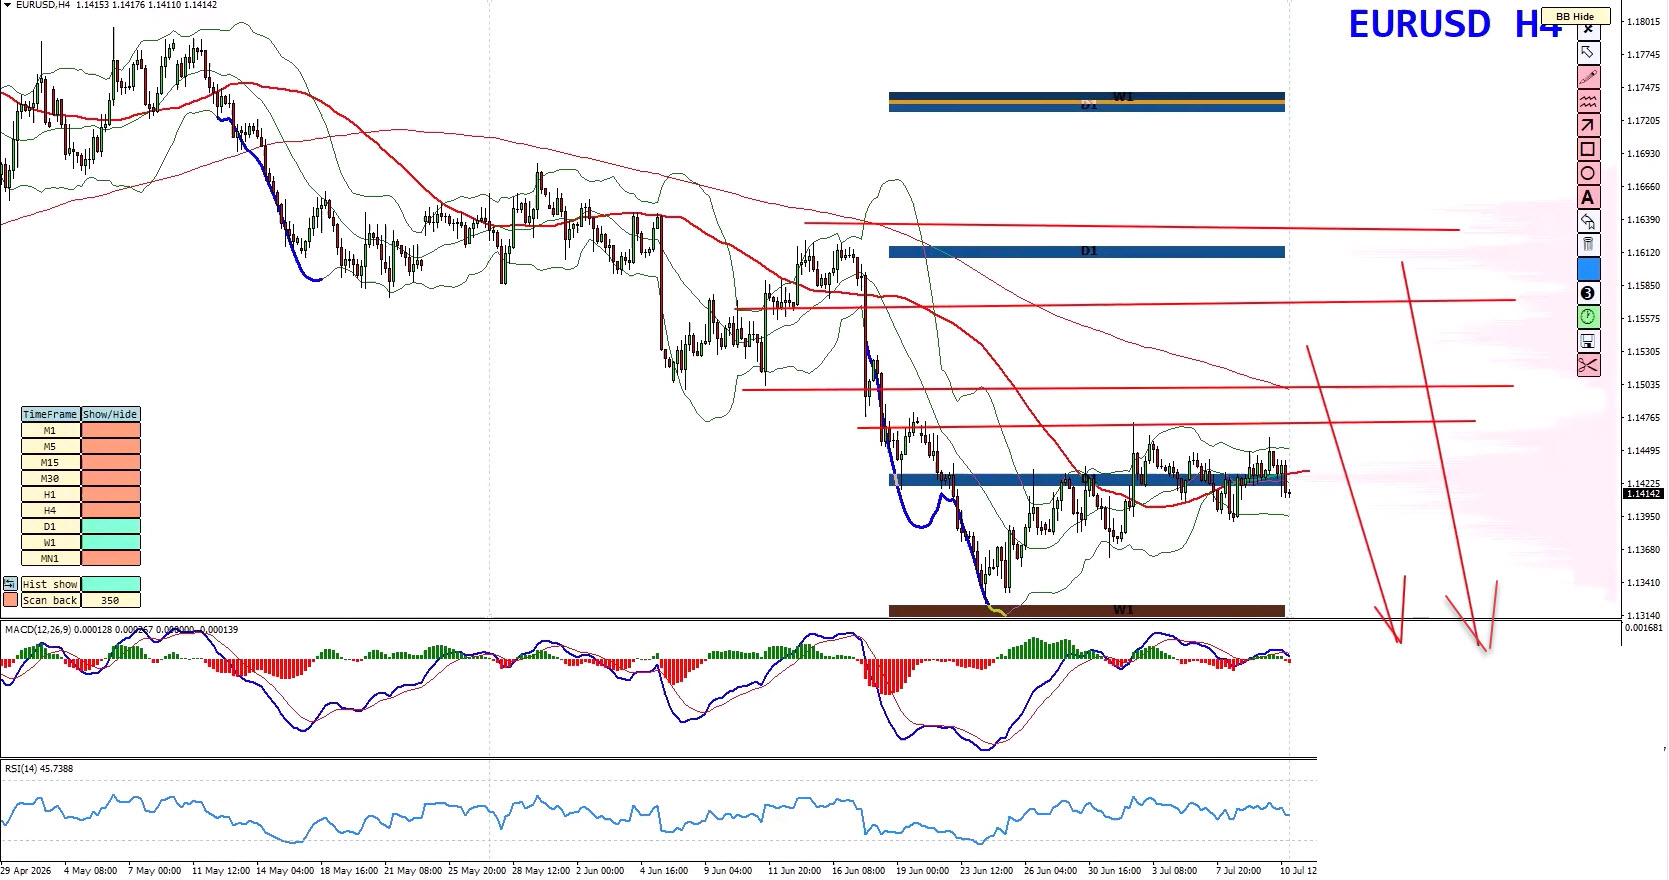
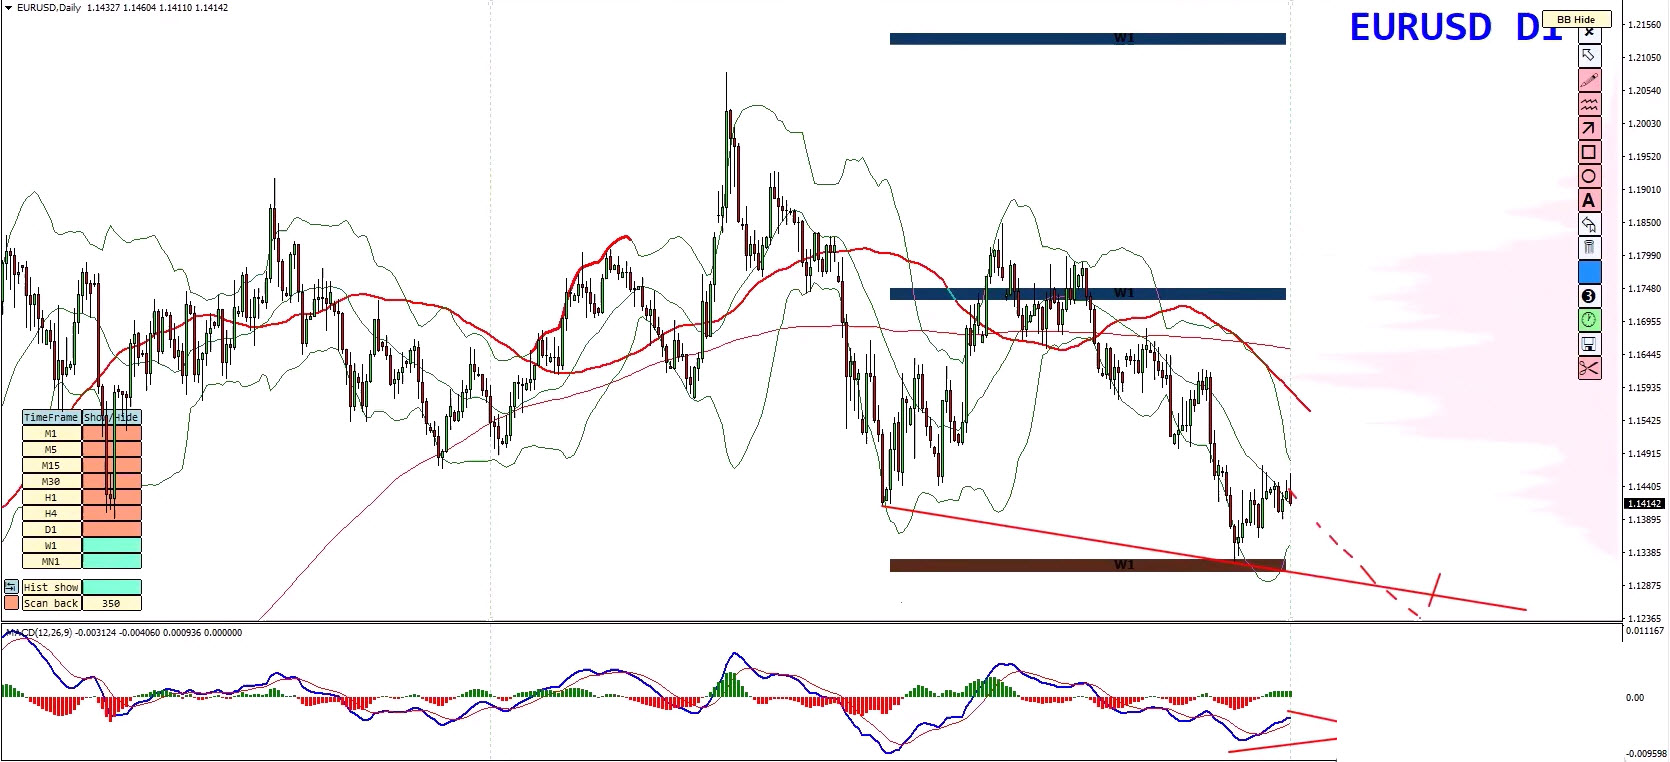
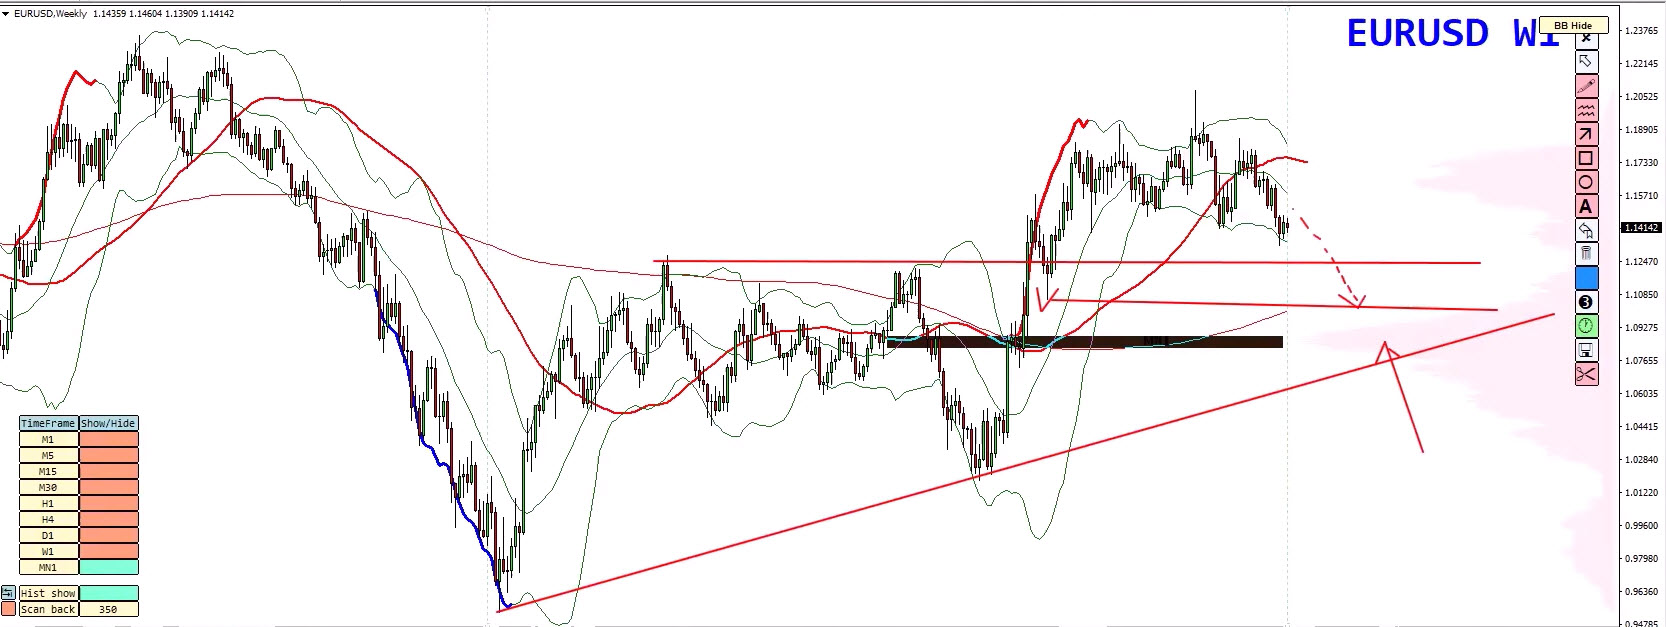
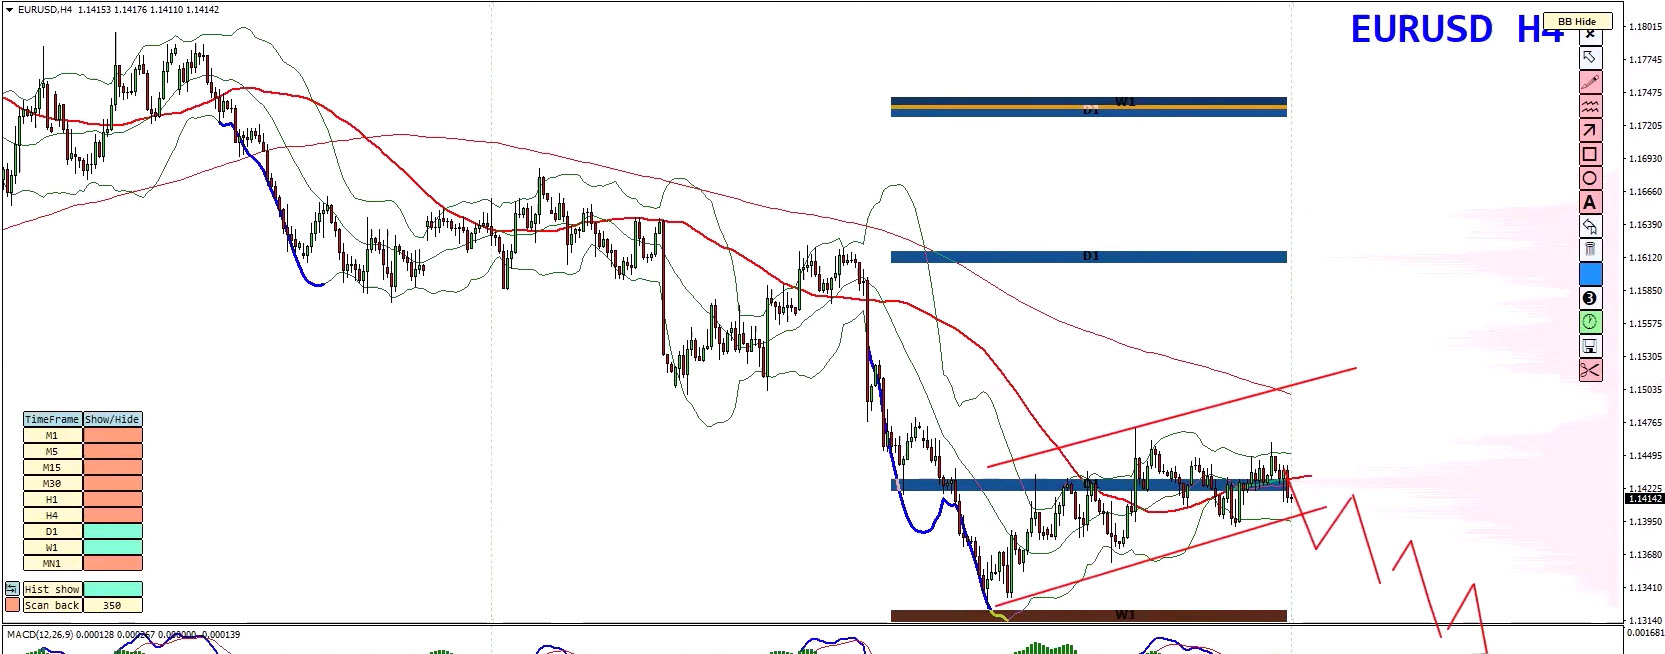
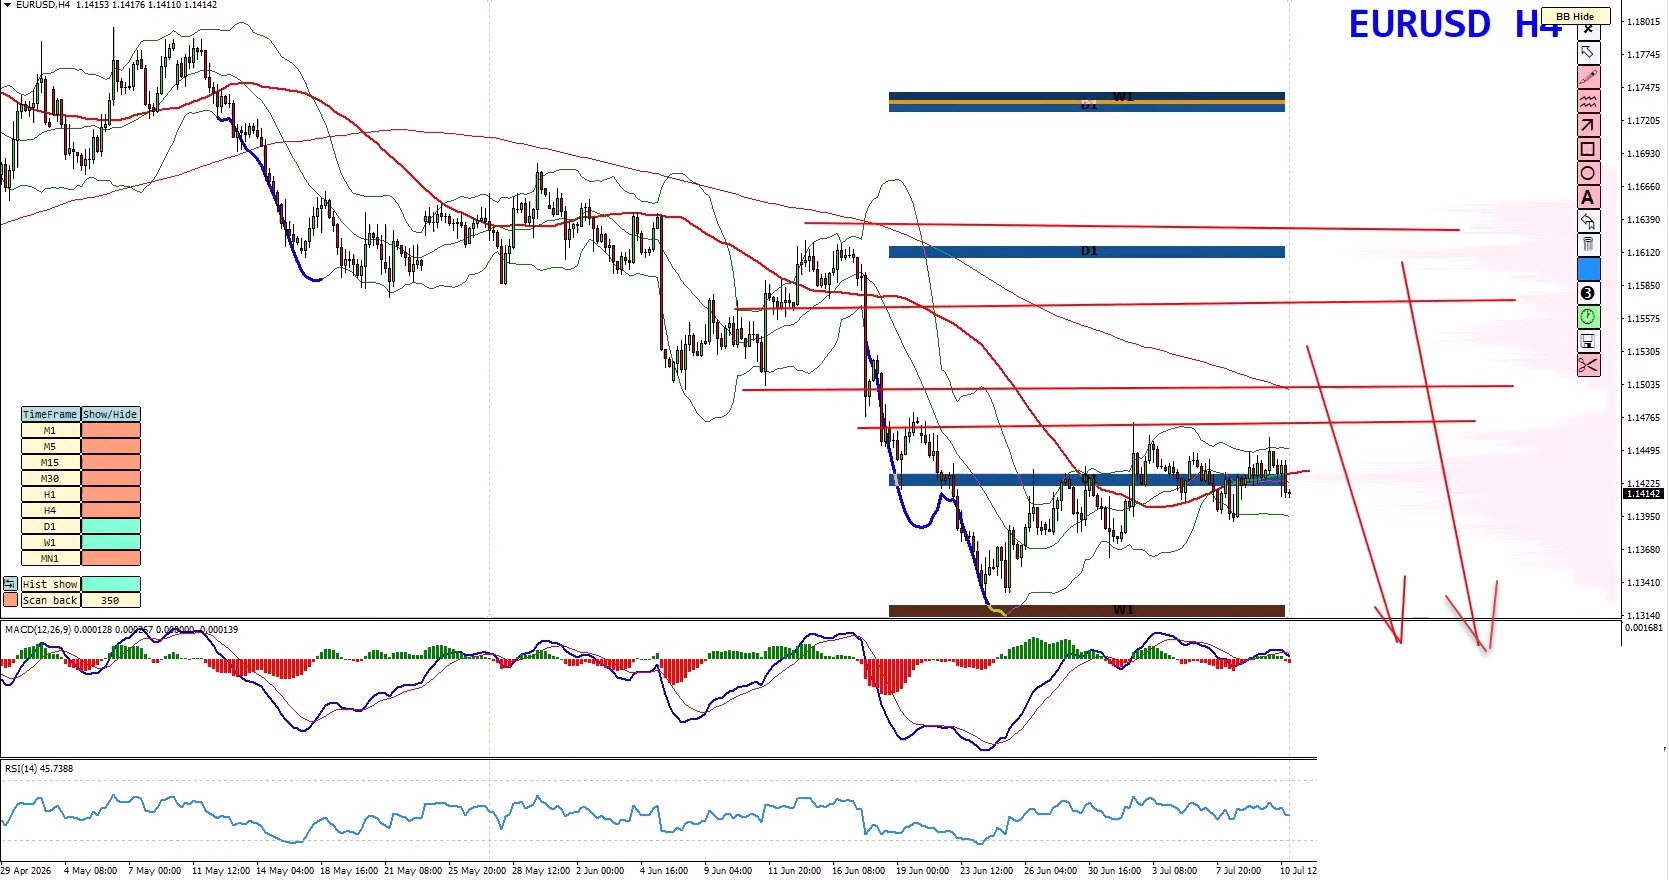
The Euro respected every major resistance area discussed in last week’s forecast, reinforcing the bearish outlook.
As long as the current resistance structure continues to hold, the path of least resistance remains to the downside.
The market is likely preparing for another push lower that could:
Several technical factors continue supporting this outlook:
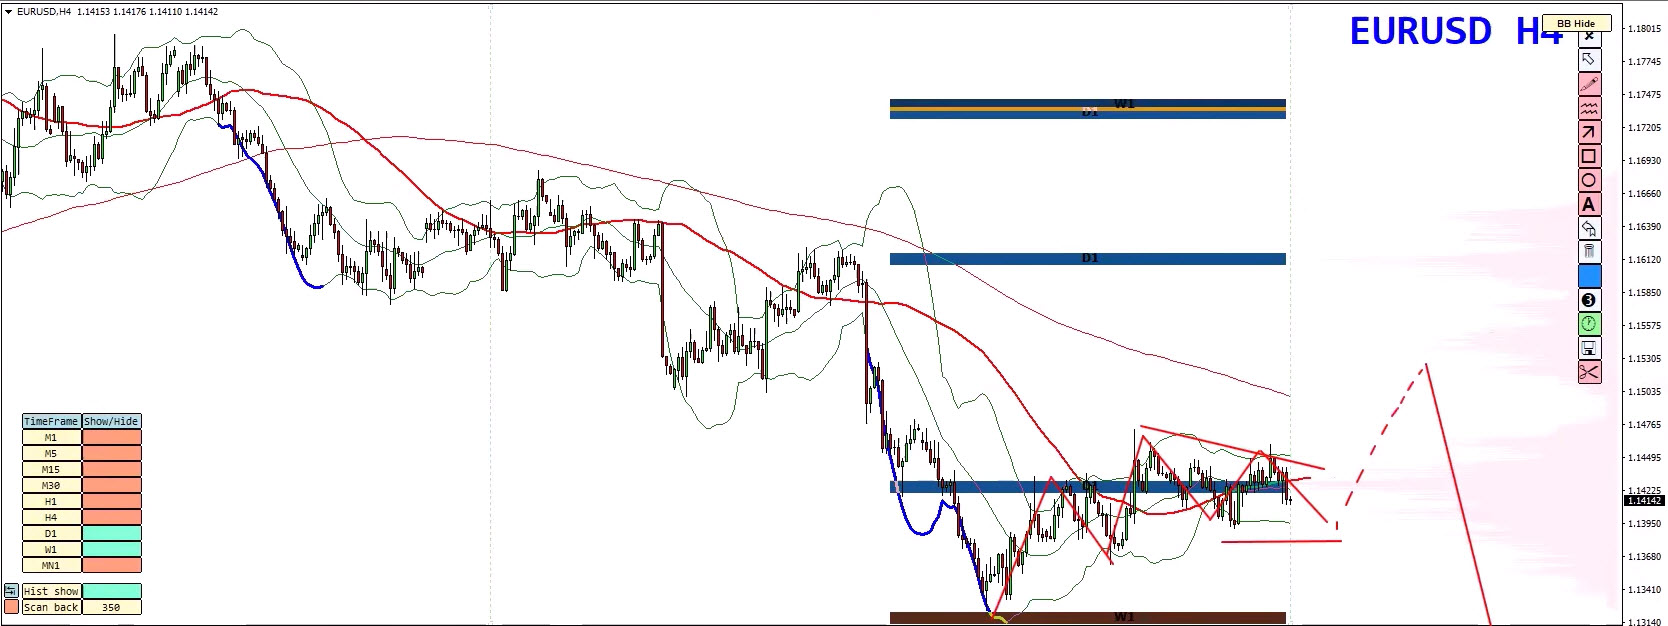
EUR/USD may continue developing a larger zigzag correction before sellers regain control.
In this case, another rally toward resistance would likely provide an attractive selling opportunity.
The second possibility is an earlier breakdown below the current corrective structure.
If price begins creating lower highs and lower lows on the 4-hour chart, sellers may quickly drive the pair toward the projected downside targets.
As long as resistance remains intact, selling rallies continues to be the preferred strategy.
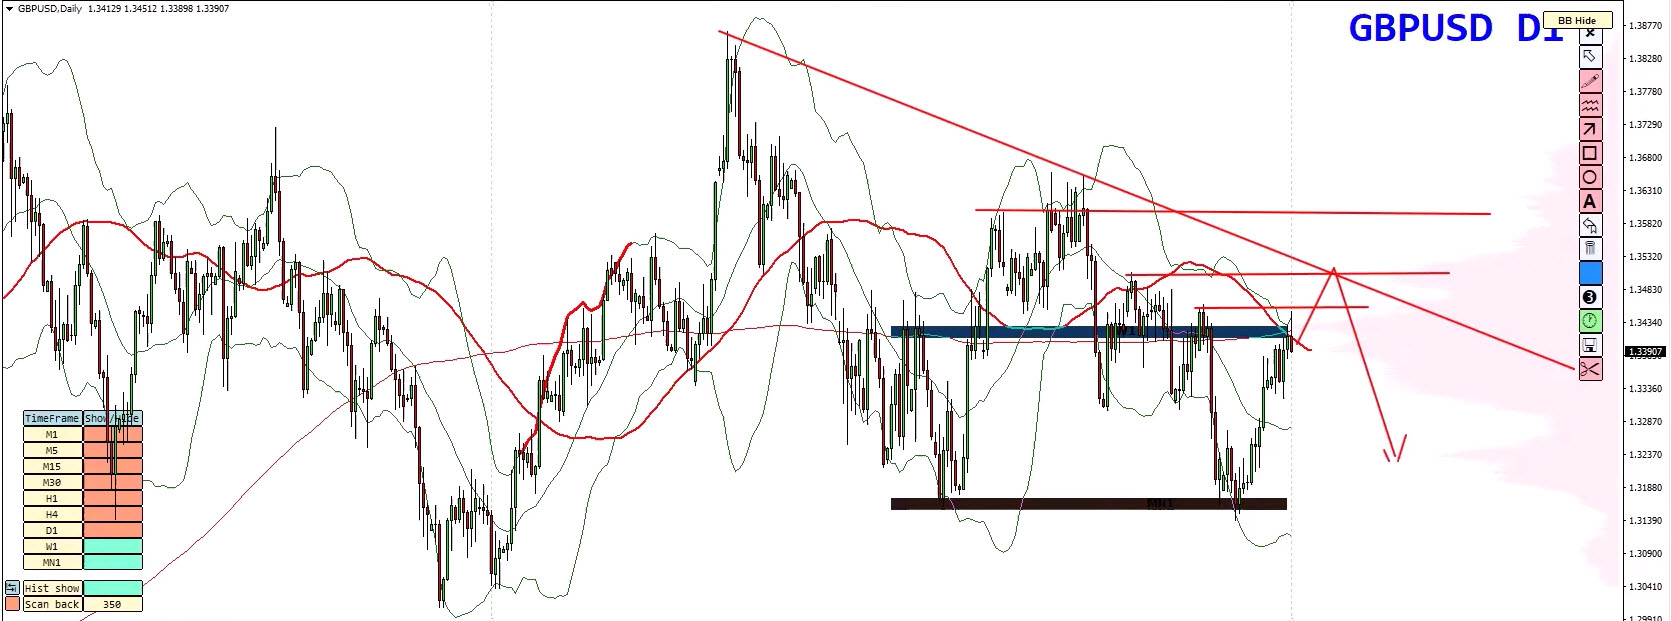
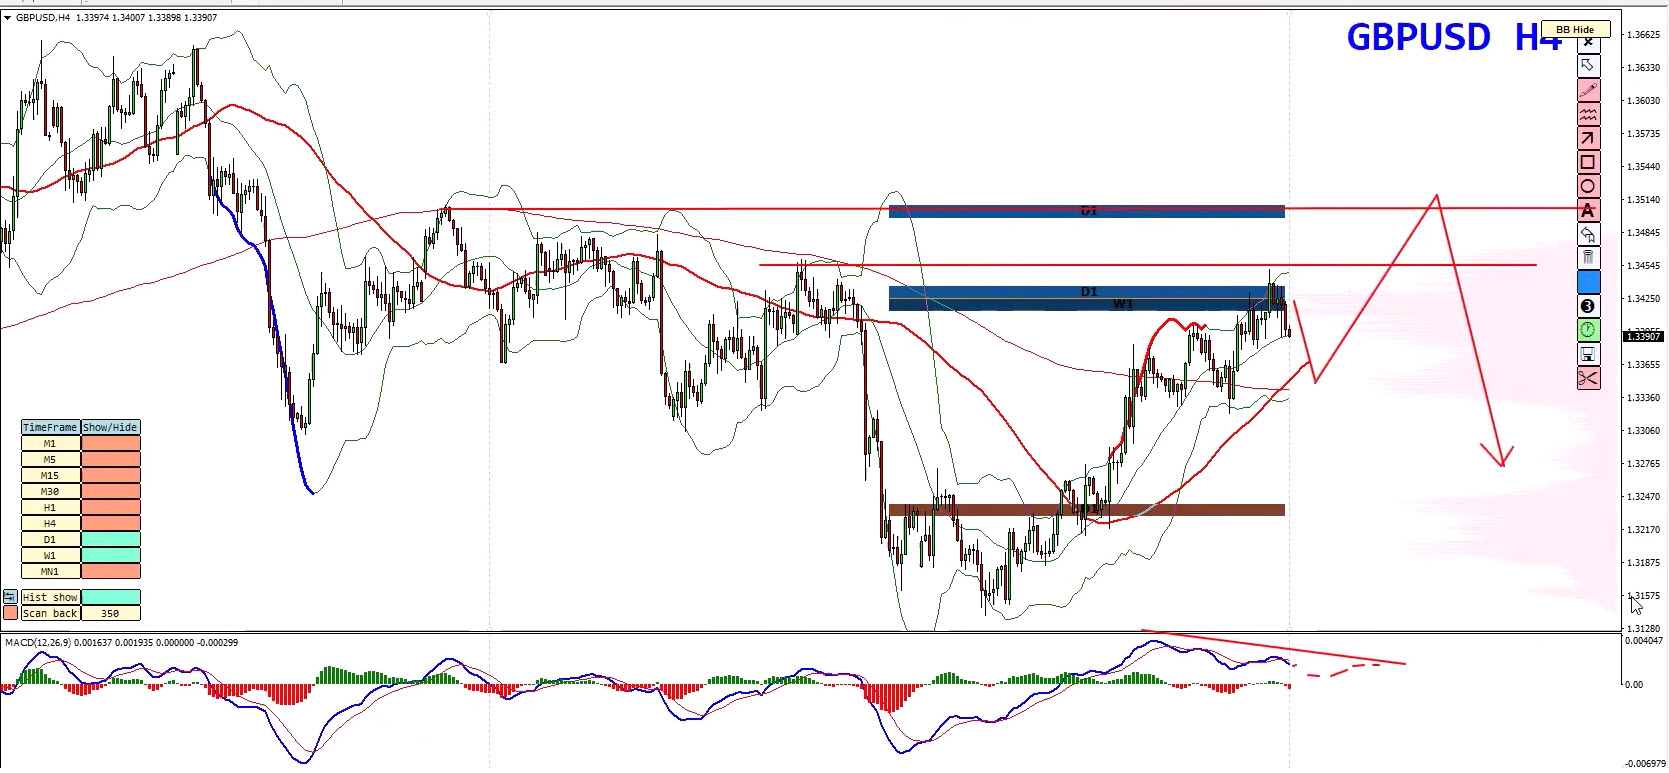
Last week’s forecast anticipated another rally before renewed selling pressure.
Price followed that roadmap remarkably well.
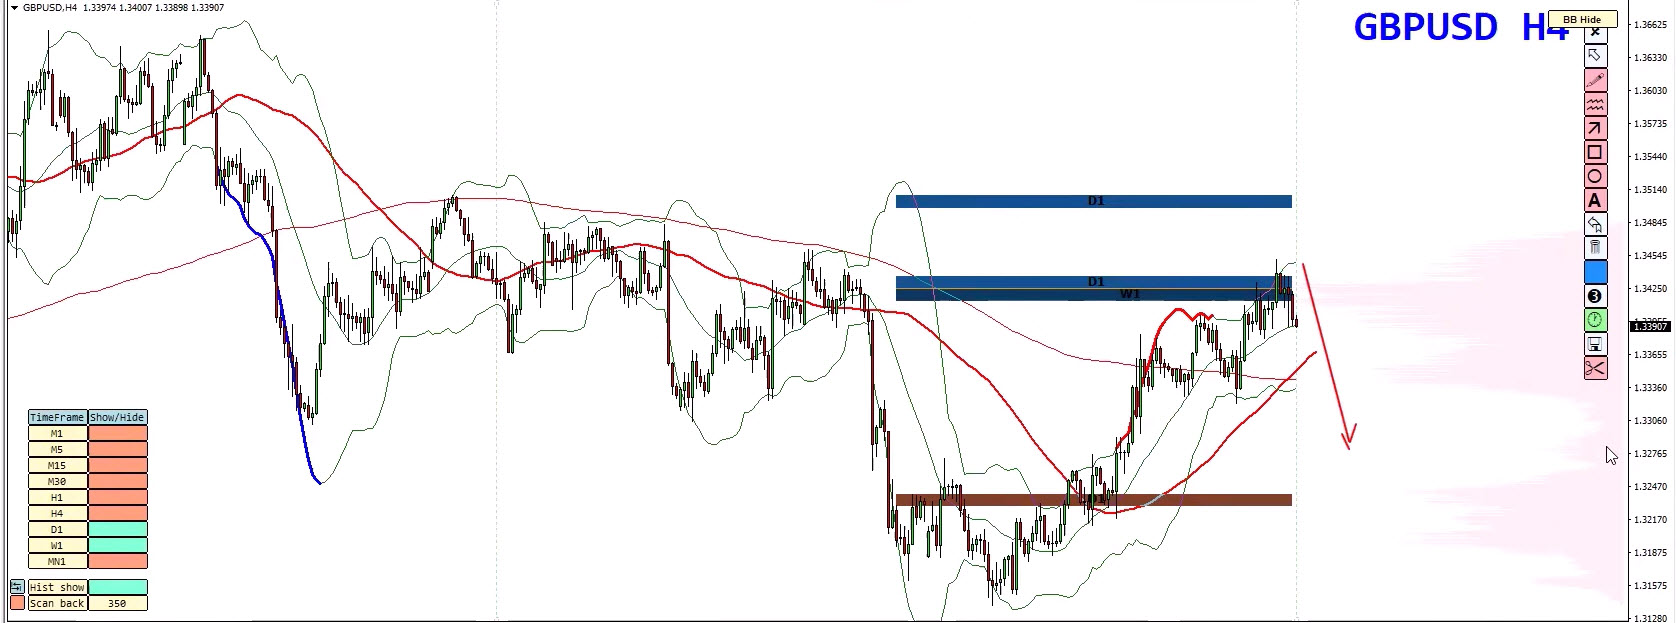
Now attention shifts toward several important resistance levels that could trigger the next bearish move.
Current resistance includes:
Even if GBP/USD attempts one final push higher, it may simply provide another opportunity for sellers.
Price might move directly from here
False breakouts above recent highs combined with bearish MACD divergence would strengthen the bearish case significantly.
The preferred approach remains:
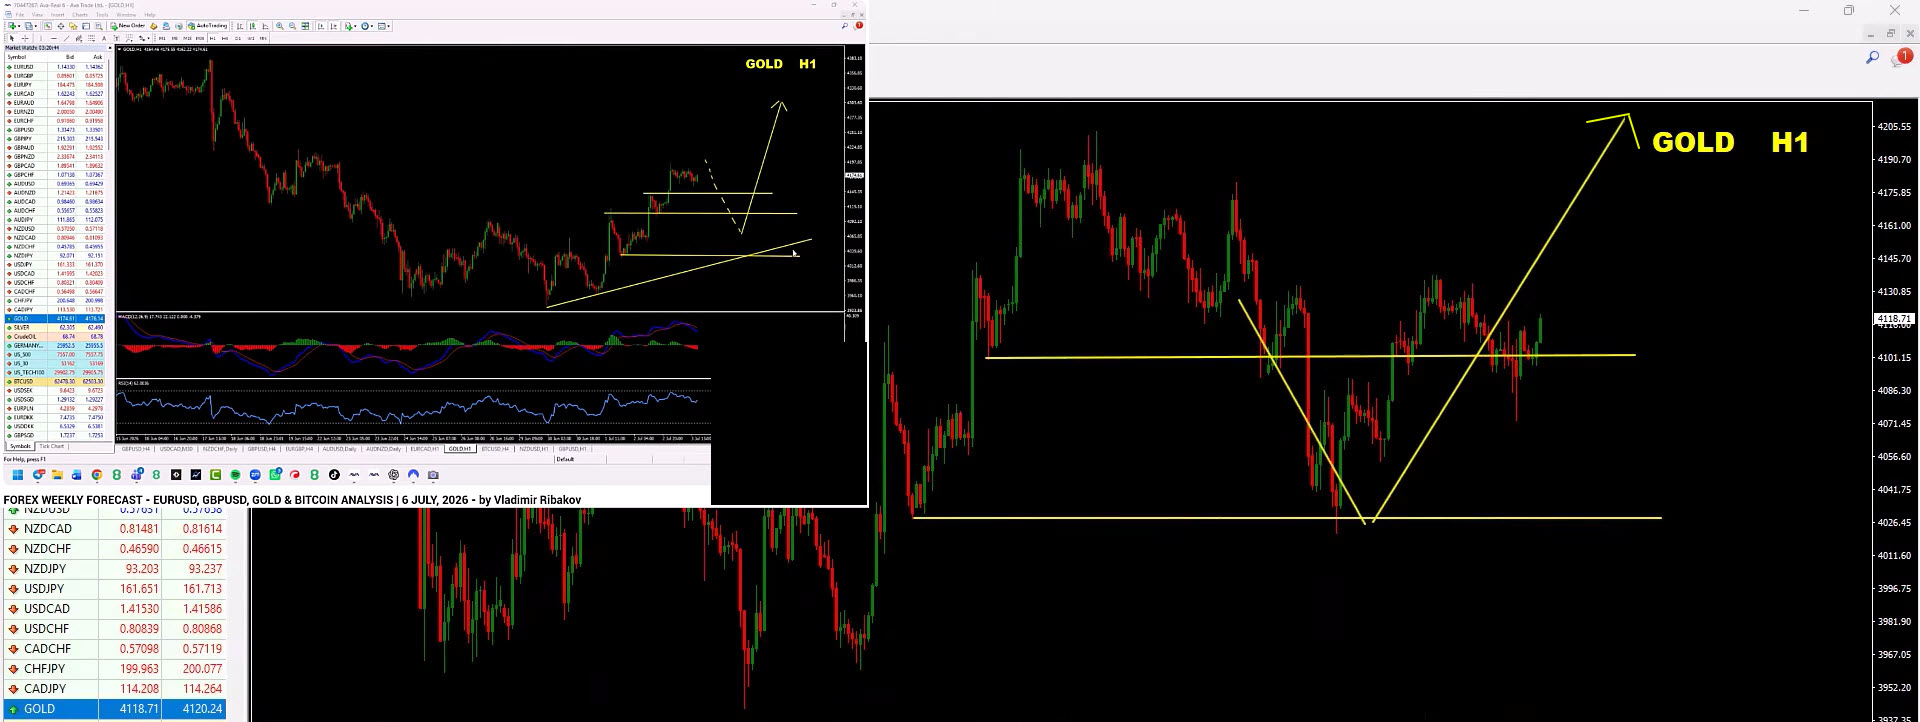
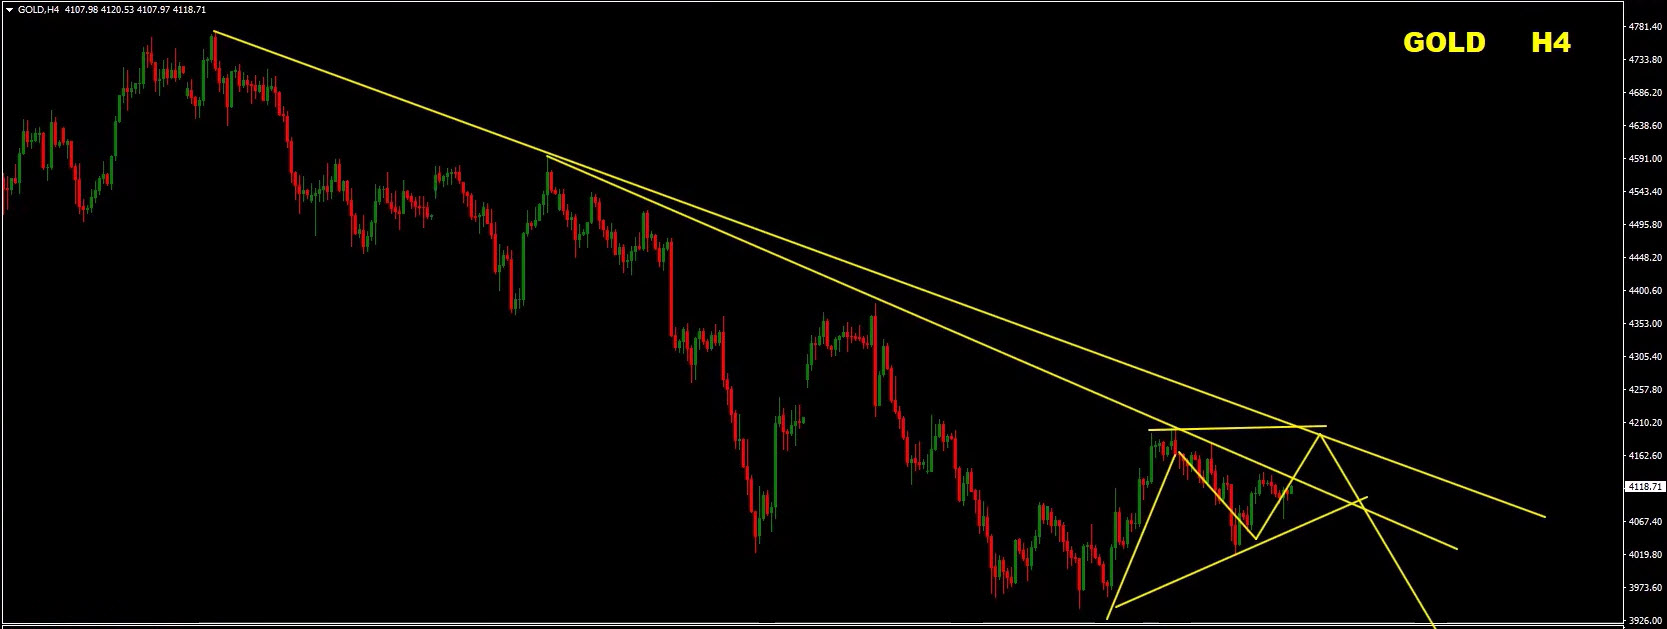
Gold respected the support zone highlighted in last week’s analysis.
After producing a textbook false breakout followed by a bullish engulfing pattern, buyers stepped in aggressively and pushed prices higher.
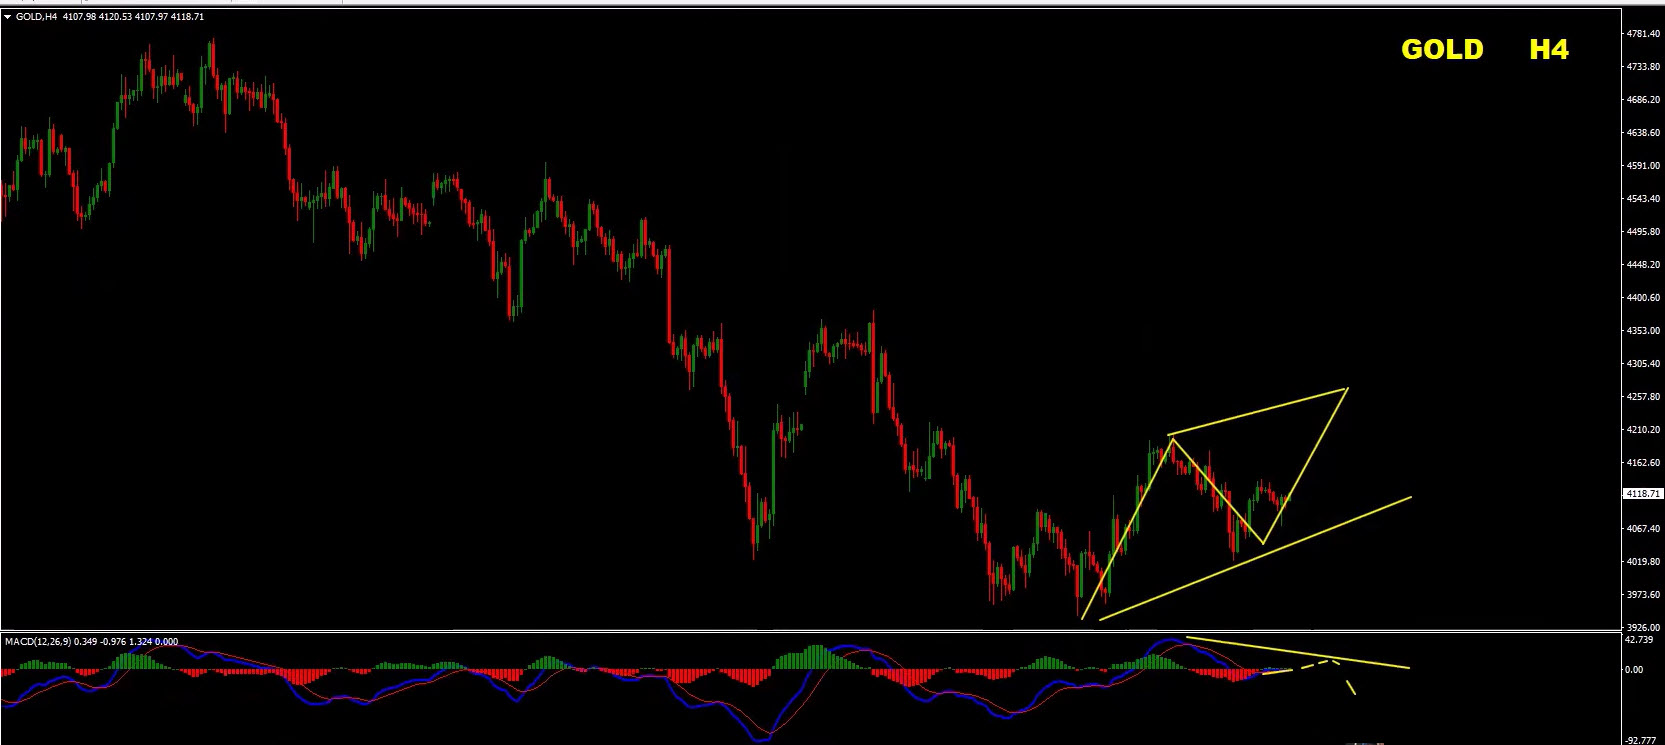
The current structure still appears corrective.
The market could continue developing:
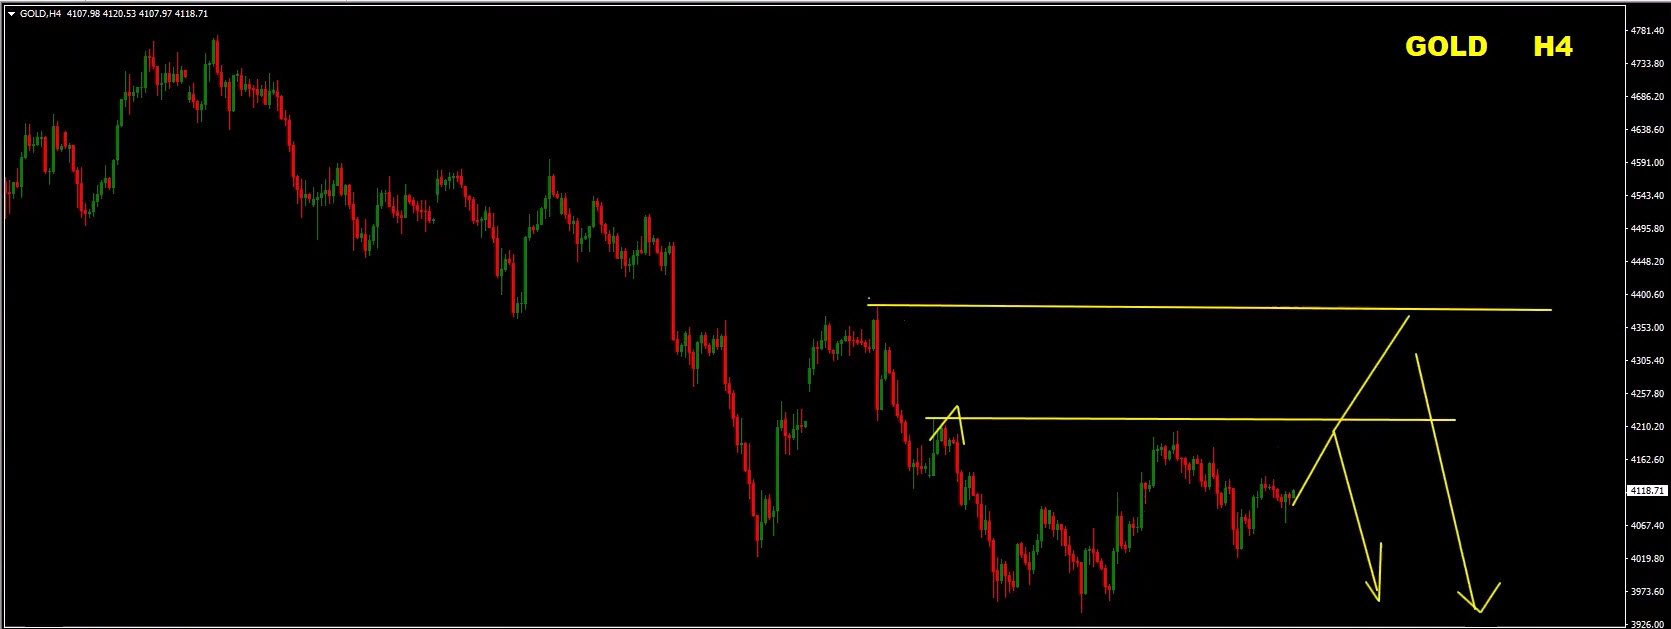
Several technical barriers deserve close attention:
Should these areas reject price, Gold could transition into a larger bearish correction.
Although short-term momentum remains constructive, rallies may eventually become selling opportunities.
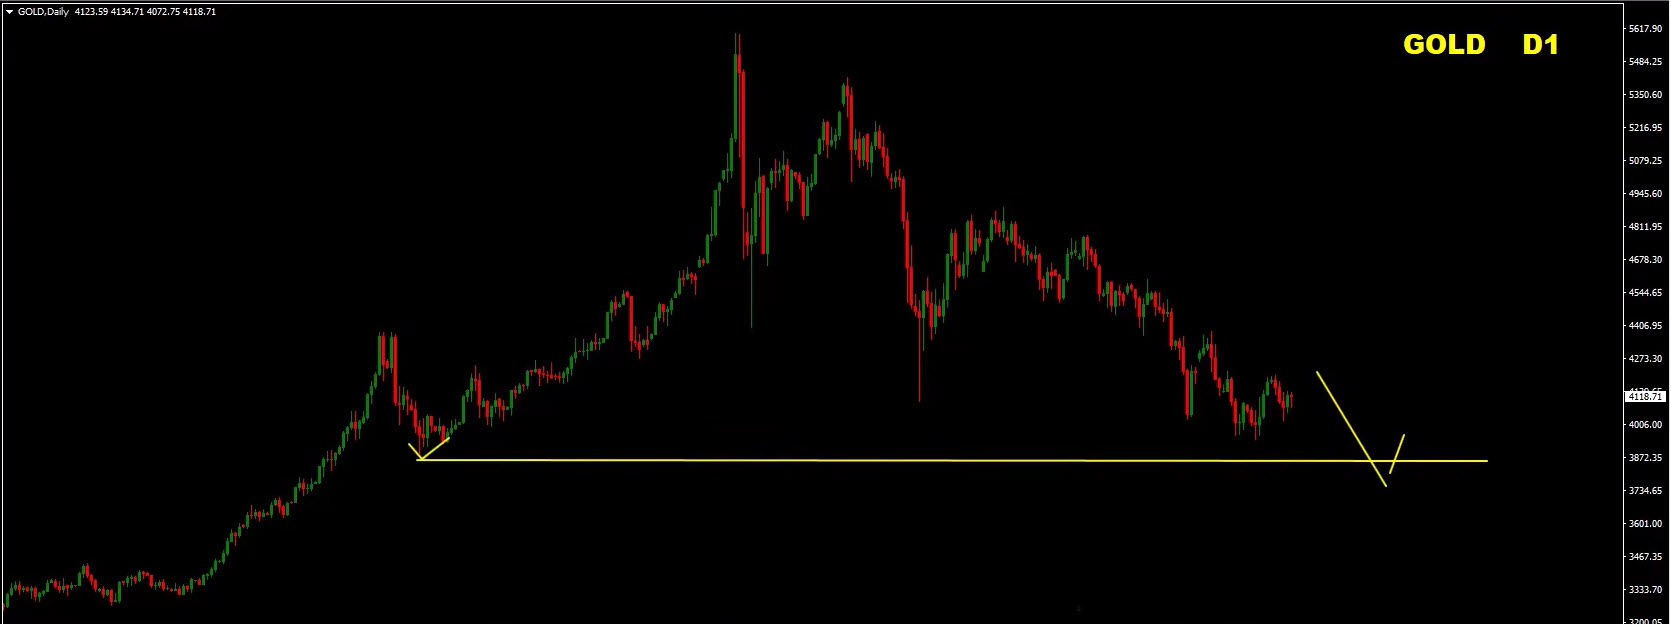
A break lower after completing the correction could send Gold toward the major daily support around 3,890, making this an important level to monitor over the coming weeks.
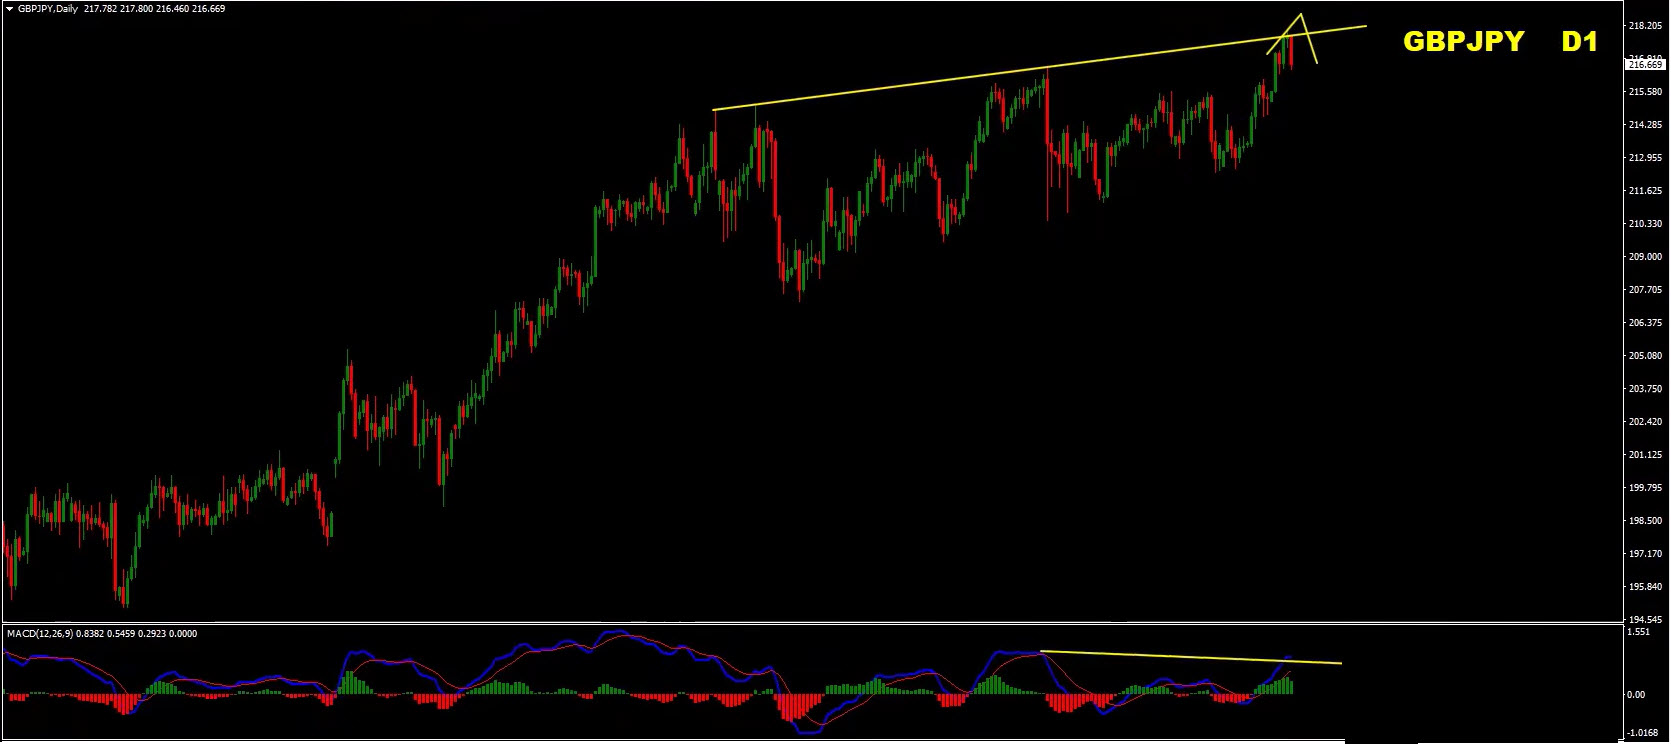
GBP/JPY is one of the most interesting charts this week.
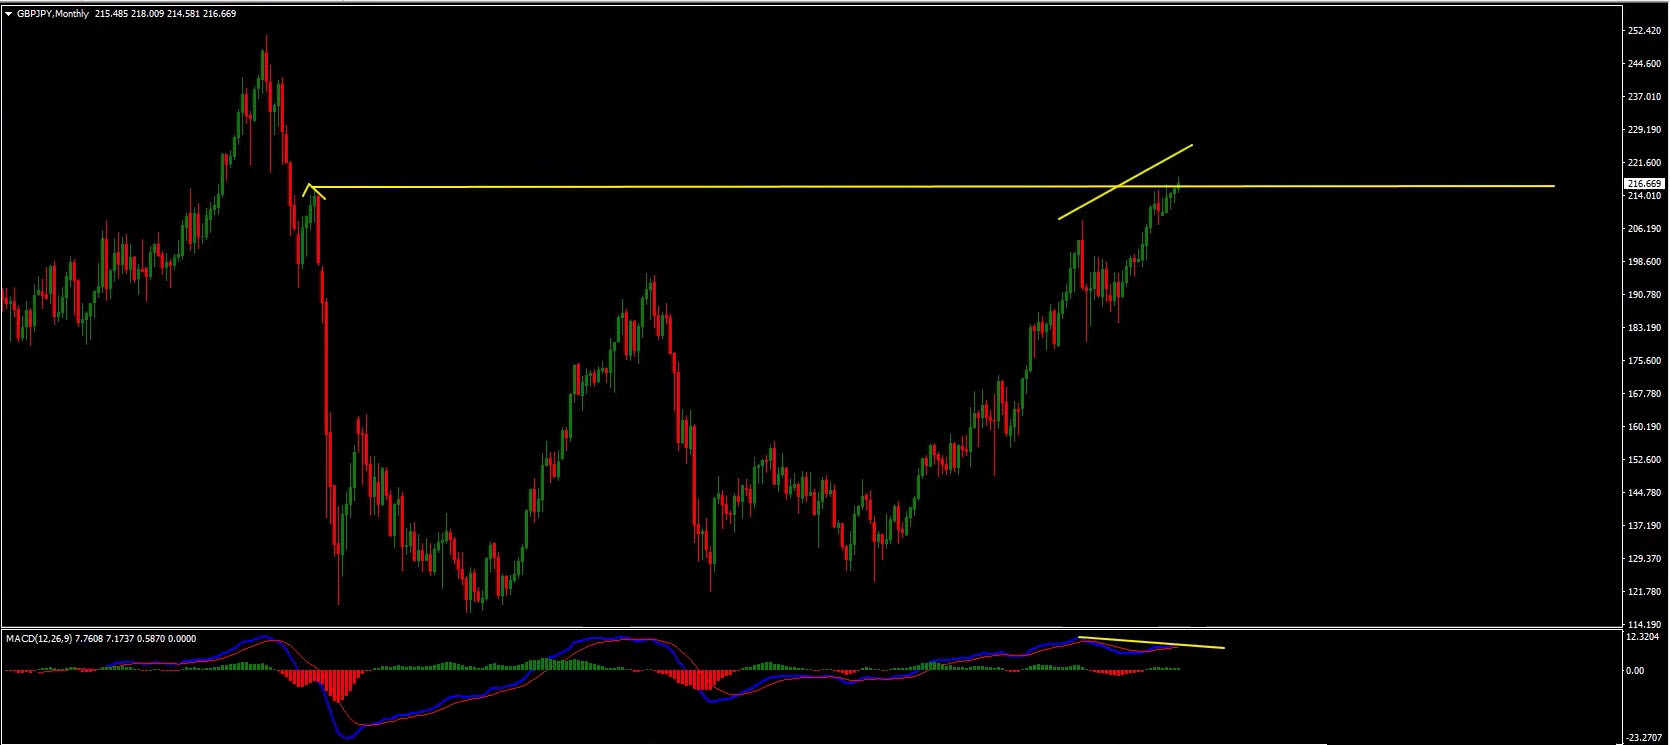
The pair is approaching a significant monthly resistance while simultaneously producing bearish divergence across multiple timeframes.
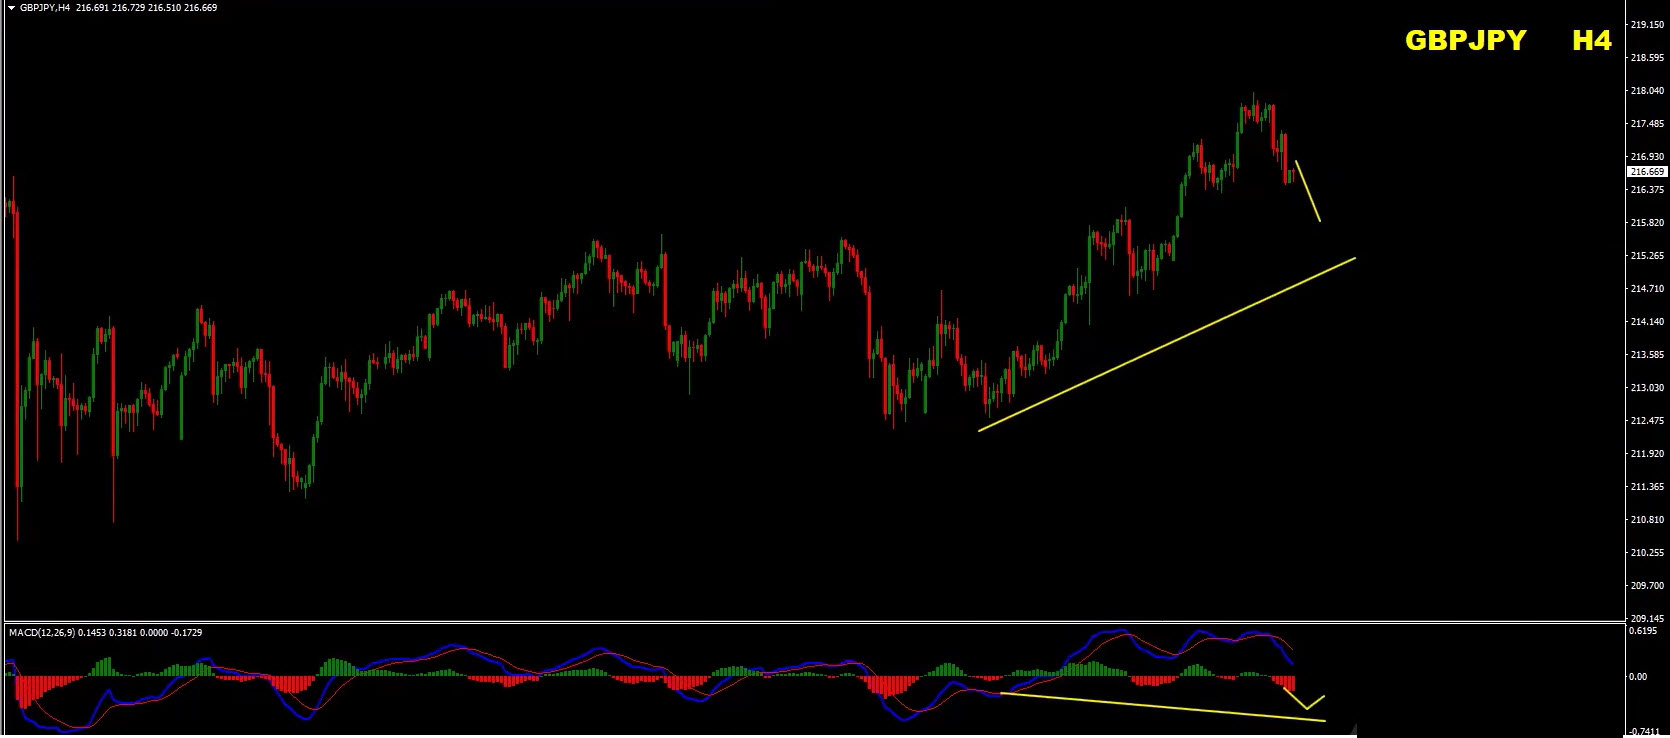
Price continues making higher highs while the MACD forms lower highs.
This creates a classic bearish divergence at a historically significant resistance level.
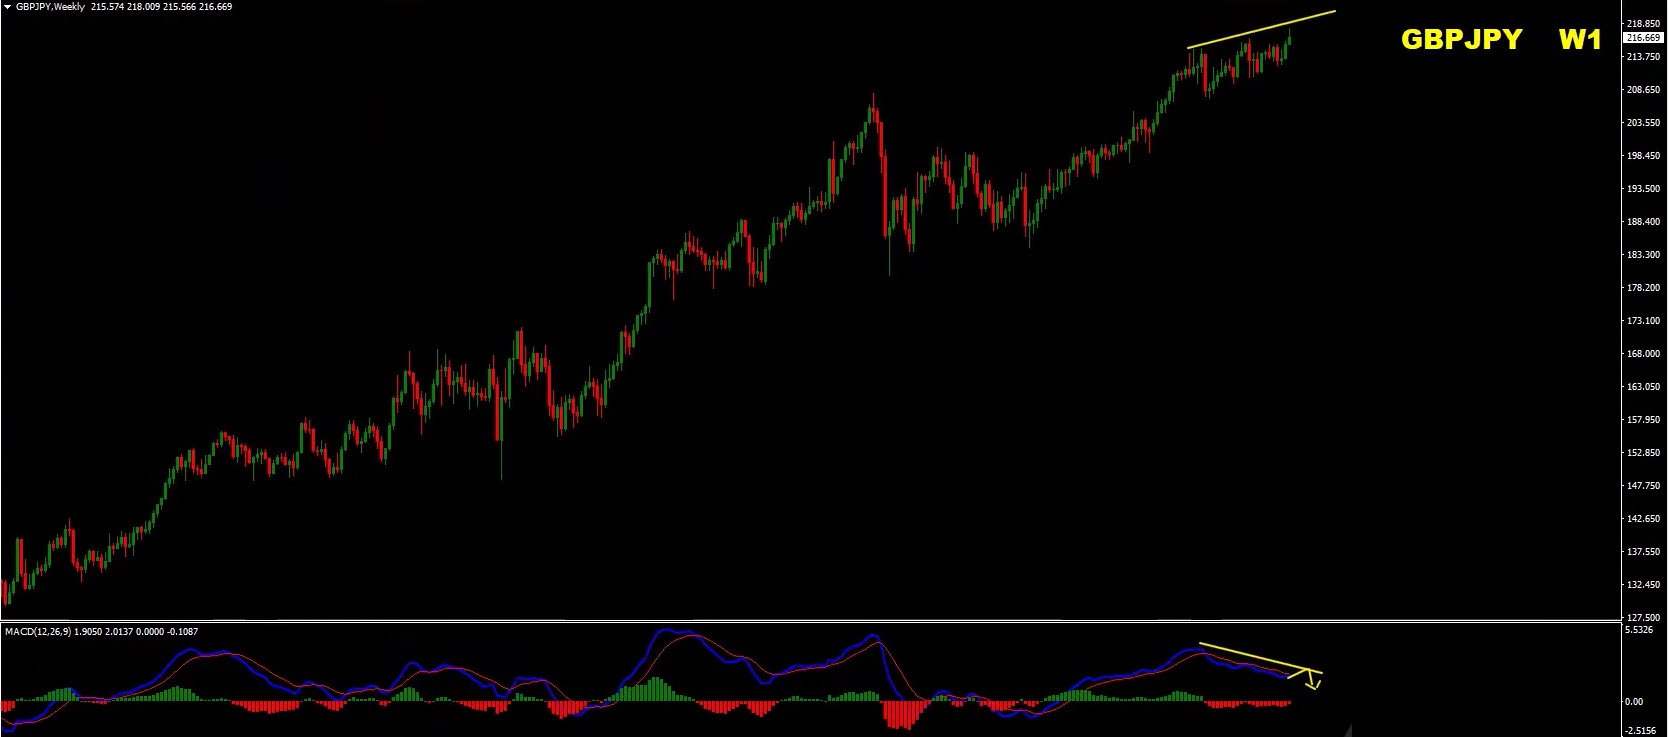
The weekly timeframe reinforces the same idea.
Momentum continues weakening despite higher prices.
The daily chart has already begun showing early reversal characteristics with:
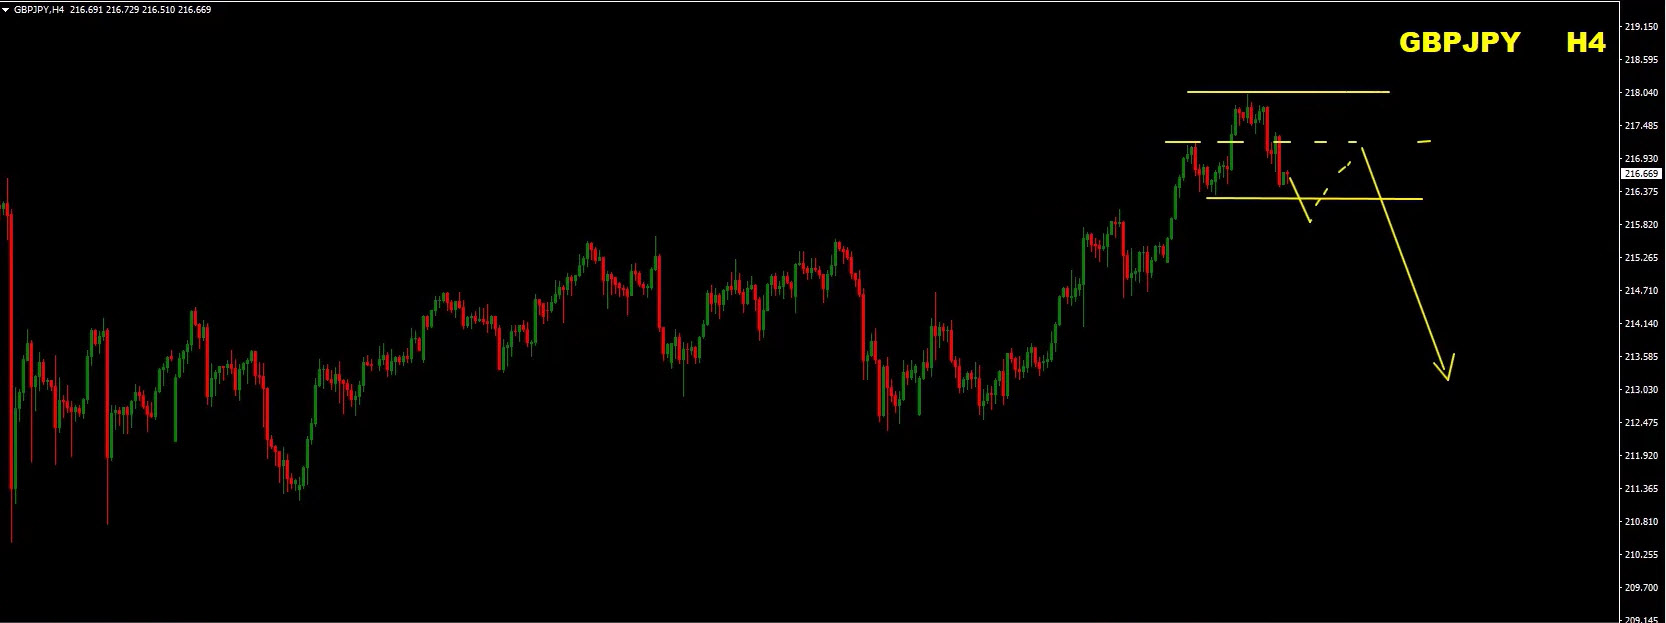
If price breaks the recent swing low and subsequent pullbacks fail below resistance, traders can begin looking for selling opportunities.
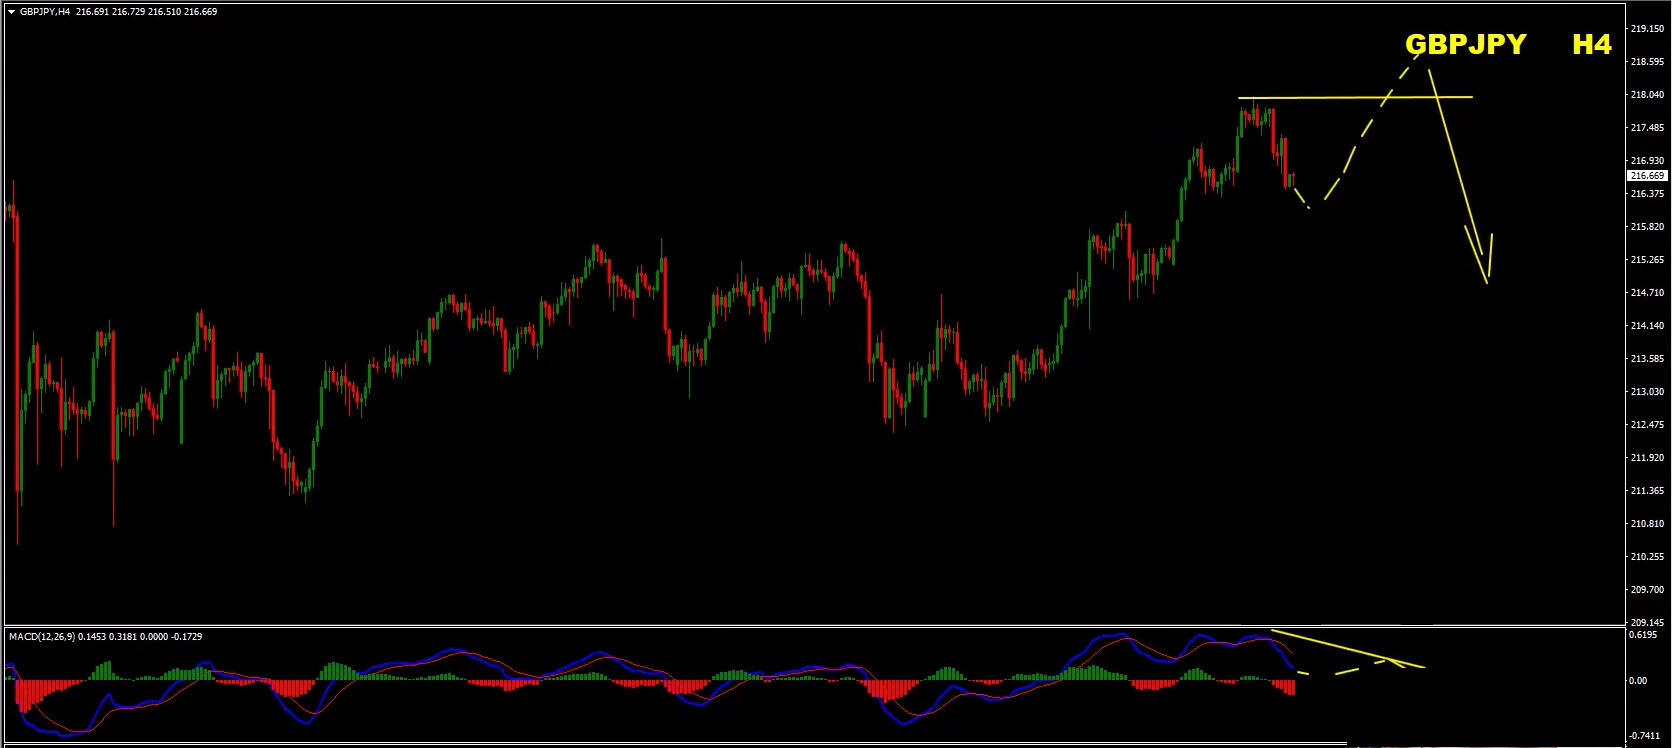
The market could first produce a final bullish move.
Hidden bullish divergence may form before price makes one last false breakout above recent highs.
If that occurs while higher-timeframe bearish divergence remains intact, it could create one of the strongest reversal opportunities across the FX market.
Remain patient.
Allow the market to complete its structure before committing to a position.
The larger timeframe signals continue favoring downside potential once confirmation appears.
Every forecast above is paired with two scenarios. Why? Because great trading is not about being right — it’s about being ready. Let the market confirm the bias. Use your system, manage risk, and execute only when the structure and confirmation align.
Want to access the tools, systems, and real-time education we use daily?
With AvaTrade Broker’s support, you can now enjoy up to one full year of access to the Home Trader Club — including:
All professional trading systems
Access to our new project, the Home Trader Club trade copier, where our traders trade and you can copy.
Real-time trade ideas and setups
Full access to our course library and trading marketplace
Wishing you a profitable week ahead!
Vladimir Ribakov
Internationally Certified Financial Technician
Home Trader Club
Interest rates are one of the most important fundamental forces in the Forex market. But…
The latest U.S. employment report has delivered a significant warning for the market. With only…
The Forex market does not always offer clear trading opportunities. Sometimes, price moves sharply in…
Open social media for a few minutes and you can easily find someone talking about…
EURUSD, GBPUSD, USDJPY, Gold and Bitcoin remain at important technical levels as volatility and geopolitical…
A winning trade feels good. A series of winning trades feels even better. Confidence increases.…